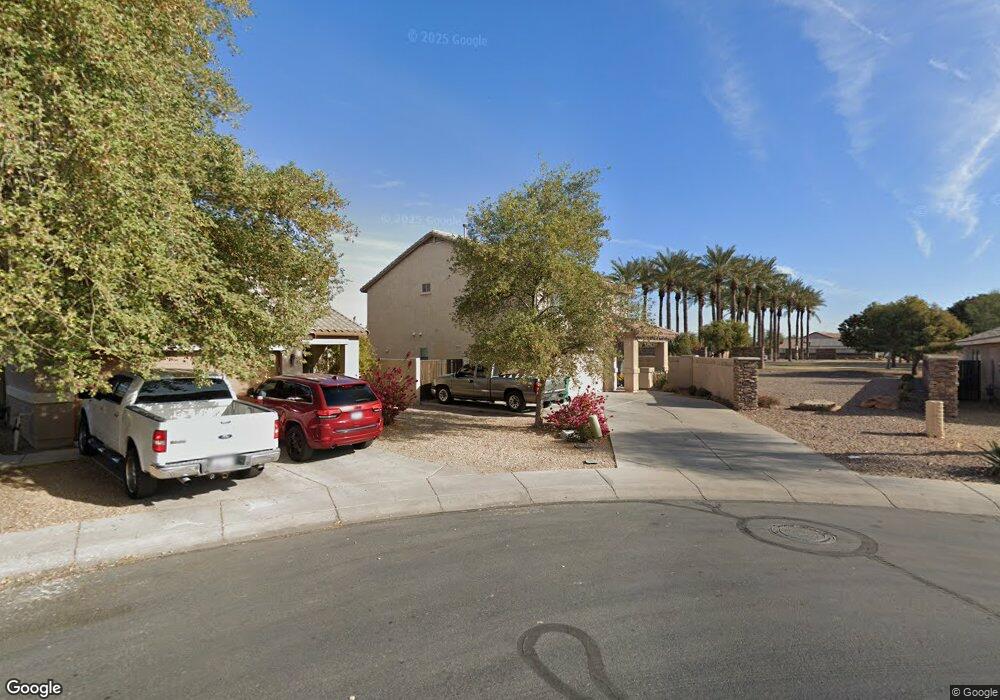
43794 W Lindgren Dr Maricopa, AZ 85138
Rancho El Dorado NeighborhoodEstimated Value: $313,000 - $364,000
4
Beds
3
Baths
2,114
Sq Ft
$160/Sq Ft
Est. Value
About This Home
This home is located at 43794 W Lindgren Dr, Maricopa, AZ 85138 and is currently estimated at $337,813, approximately $159 per square foot. 43794 W Lindgren Dr is a home located in Pinal County with nearby schools including Butterfield Elementary School, Maricopa High School, and Maricopa Wells Middle School.
Ownership History
Date
Name
Owned For
Owner Type
Purchase Details
Closed on
Feb 16, 2017
Sold by
Sencecal Kerriann and Charlton Karriann
Bought by
Ramirez Ana S and Ramirez Ana
Current Estimated Value
Home Financials for this Owner
Home Financials are based on the most recent Mortgage that was taken out on this home.
Original Mortgage
$156,400
Outstanding Balance
$129,092
Interest Rate
4.09%
Mortgage Type
New Conventional
Estimated Equity
$208,721
Purchase Details
Closed on
Oct 19, 2011
Sold by
Glab Jeffrey and Glab Shannon
Bought by
Charlton Kerriann and Kirby Kerriann
Purchase Details
Closed on
Mar 10, 2006
Sold by
Maracay Rancho Llc
Bought by
Glab Jeffrey and Glab Shannon
Home Financials for this Owner
Home Financials are based on the most recent Mortgage that was taken out on this home.
Original Mortgage
$197,800
Interest Rate
5.87%
Mortgage Type
Unknown
Create a Home Valuation Report for This Property
The Home Valuation Report is an in-depth analysis detailing your home's value as well as a comparison with similar homes in the area
Home Values in the Area
Average Home Value in this Area
Purchase History
| Date | Buyer | Sale Price | Title Company |
|---|---|---|---|
| Ramirez Ana S | $170,000 | Stewart Title Arizona Agency | |
| Charlton Kerriann | $82,000 | Great American Title Agency | |
| Glab Jeffrey | $247,264 | First American Title Ins Co |
Source: Public Records
Mortgage History
| Date | Status | Borrower | Loan Amount |
|---|---|---|---|
| Open | Ramirez Ana S | $156,400 | |
| Previous Owner | Glab Jeffrey | $197,800 |
Source: Public Records
Tax History
| Year | Tax Paid | Tax Assessment Tax Assessment Total Assessment is a certain percentage of the fair market value that is determined by local assessors to be the total taxable value of land and additions on the property. | Land | Improvement |
|---|---|---|---|---|
| 2025 | $1,997 | $24,427 | -- | -- |
| 2024 | $1,945 | $30,475 | -- | -- |
| 2023 | $1,945 | $22,565 | $4,443 | $18,122 |
| 2022 | $1,889 | $16,913 | $2,962 | $13,951 |
| 2021 | $1,804 | $15,578 | $0 | $0 |
| 2020 | $1,722 | $13,873 | $0 | $0 |
| 2019 | $1,656 | $12,837 | $0 | $0 |
| 2018 | $1,634 | $12,017 | $0 | $0 |
| 2017 | $1,556 | $12,128 | $0 | $0 |
| 2016 | $1,965 | $12,383 | $1,250 | $11,133 |
| 2014 | $1,886 | $8,595 | $1,000 | $7,595 |
Source: Public Records
Map
Nearby Homes
- 43782 W Sagebrush Trail
- 43921 W Sagebrush Trail
- 21019 N Sansom Dr
- 43602 W Sansom Dr
- 43579 W Sansom Dr
- 43626 W Colby Dr
- 43682 W Elm Dr
- 43568 W Bedford Dr
- 44133 W Snow Dr
- 21099 N Alma Dr
- 21047 N Alma Dr
- 44175 W Snow Dr
- 43714 W Rio Grande Dr
- 43349 W Wallner Dr
- 44188 W Cydnee Dr
- 21324 N Karsten Dr
- 44212 W Cydnee Dr
- 43658 W Rio Grande Dr
- 43282 W Lindgren Dr
- 20652 N Donithan Way
- 43810 W Lindgren Dr
- 43826 W Lindgren Dr
- 21137 N Sansom Dr
- 43842 W Lindgren Dr
- 21121 N Sansom Dr
- 21128 N Sansom Dr
- 43858 W Lindgren Dr
- 21105 N Sansom Dr
- 43809 W Sagebrush Trail
- 21114 N Sansom Dr
- 43878 W Lindgren Dr
- 43874 W Lindgren Dr
- 43823 W Sagebrush Trail
- 43781 W Sagebrush Trail
- 43837 W Sagebrush Trail
- 21089 N Sansom Dr
- 43767 W Sagebrush Trail
- 21129 N Leona Blvd
- 43851 W Sagebrush Trail
- 43890 W Lindgren Dr
Your Personal Tour Guide
Ask me questions while you tour the home.