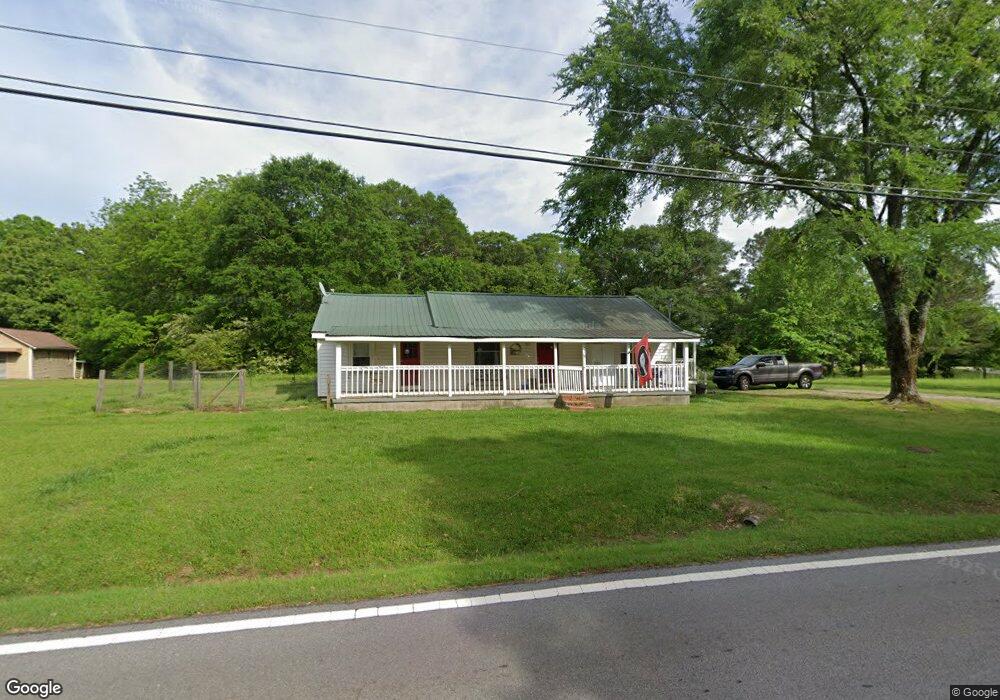
438 Clem Lowell Rd Carrollton, GA 30116
Estimated Value: $145,315 - $240,000
3
Beds
1
Bath
1,200
Sq Ft
$160/Sq Ft
Est. Value
About This Home
This home is located at 438 Clem Lowell Rd, Carrollton, GA 30116 and is currently estimated at $192,329, approximately $160 per square foot. 438 Clem Lowell Rd is a home located in Carroll County with nearby schools including Whitesburg Elementary School, Central Middle School, and Central High School.
Ownership History
Date
Name
Owned For
Owner Type
Purchase Details
Closed on
Oct 2, 2023
Sold by
Warrington Janet
Bought by
Stewart Robin
Current Estimated Value
Home Financials for this Owner
Home Financials are based on the most recent Mortgage that was taken out on this home.
Original Mortgage
$39,941
Outstanding Balance
$26,292
Interest Rate
7.18%
Mortgage Type
New Conventional
Estimated Equity
$166,037
Purchase Details
Closed on
Mar 18, 2002
Sold by
Warrington Janet
Bought by
Warrington Janet
Purchase Details
Closed on
Dec 4, 2001
Sold by
Mccarty Steven J and Mccarty B
Bought by
Warrington Janet
Purchase Details
Closed on
Sep 30, 1997
Sold by
Collins Collins and Collins Reaves
Bought by
Mccarty Steven J and Mccarty B
Purchase Details
Closed on
Jan 16, 1989
Bought by
Collins Collins and Collins Reaves
Create a Home Valuation Report for This Property
The Home Valuation Report is an in-depth analysis detailing your home's value as well as a comparison with similar homes in the area
Home Values in the Area
Average Home Value in this Area
Purchase History
| Date | Buyer | Sale Price | Title Company |
|---|---|---|---|
| Stewart Robin | $39,941 | -- | |
| Warrington Janet | -- | -- | |
| Warrington Janet | $23,000 | -- | |
| Mccarty Steven J | $38,600 | -- | |
| Collins Collins | $25,000 | -- |
Source: Public Records
Mortgage History
| Date | Status | Borrower | Loan Amount |
|---|---|---|---|
| Open | Stewart Robin | $39,941 |
Source: Public Records
Tax History Compared to Growth
Tax History
| Year | Tax Paid | Tax Assessment Tax Assessment Total Assessment is a certain percentage of the fair market value that is determined by local assessors to be the total taxable value of land and additions on the property. | Land | Improvement |
|---|---|---|---|---|
| 2024 | $998 | $48,136 | $7,181 | $40,955 |
| 2023 | $998 | $42,872 | $5,745 | $37,127 |
| 2022 | $844 | $33,663 | $3,830 | $29,833 |
| 2021 | $734 | $28,628 | $3,064 | $25,564 |
| 2020 | $659 | $25,682 | $2,786 | $22,896 |
| 2019 | $615 | $23,747 | $2,786 | $20,961 |
| 2018 | $549 | $20,891 | $2,603 | $18,288 |
| 2017 | $550 | $20,891 | $2,603 | $18,288 |
| 2016 | $550 | $20,891 | $2,603 | $18,288 |
| 2015 | $430 | $15,377 | $2,944 | $12,433 |
| 2014 | $432 | $15,378 | $2,944 | $12,433 |
Source: Public Records
Map
Nearby Homes
- 184 Whooping Creek Church Rd
- 2716 Georgia 16
- 2800 Sr 16
- 2800 Georgia 16
- 185 White Oak Ct
- 143 Oak Leaf Dr Unit 163
- 143 Oak Leaf Dr
- 0 Clem Lowell Rd Unit 10479926
- 0 Clem Lowell Rd Unit 147578
- 0 Clem Lowell Rd Unit 7630669
- 197 Westbrook Rd
- 2181 2201 Star Point
- 0 Heath Rd Unit 20173471
- 00 Heath Rd
- 113 Red Oak Ln
- 103 Red Oak Ln
- 1075 Davis Rd
- 2033 Old Newnan Rd
- 40 Westbrook Rd
- 106 Victoria Way
- 433 Clem Lowell Rd
- 426 Clem Lowell Rd
- 445 Clem Lowell Rd
- 414 Clem Lowell Rd
- 460 Clem Lowell Rd
- 40 Old Stagecoach Rd
- 486 Clem Lowell Rd
- 410 Clem Lowell Rd
- 53 Old Stagecoach Rd
- 385 Clem Lowell Rd
- 512 Clem Lowell Rd
- 85 Old Stagecoach Rd
- 329 Clem Lowell Rd
- 65 Cook Ln
- 297 Clem Lowell Rd
- 297 Clem Lowell Rd
- 88 Old Stagecoach Rd
- 84 Old Stagecoach Rd
- 330 Clem Lowell Rd
- 316 Clem Lowell Rd