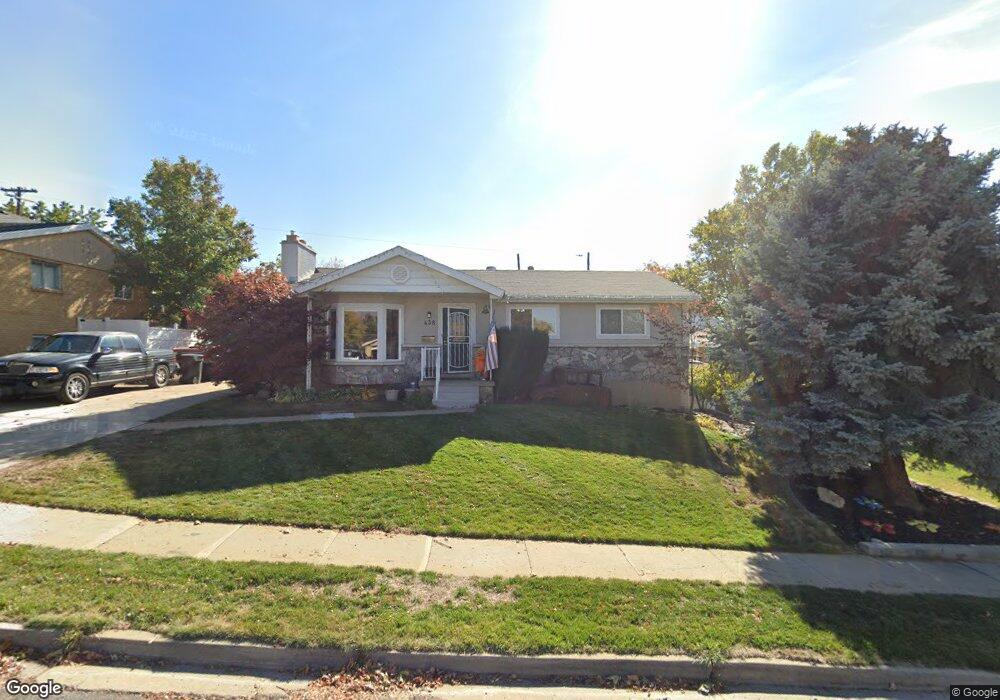
438 E 1600 S Bountiful, UT 84010
Estimated Value: $534,719 - $585,000
5
Beds
3
Baths
1,408
Sq Ft
$396/Sq Ft
Est. Value
About This Home
This home is located at 438 E 1600 S, Bountiful, UT 84010 and is currently estimated at $556,930, approximately $395 per square foot. 438 E 1600 S is a home located in Davis County with nearby schools including Valley View School, Mueller Park Junior High School, and Bountiful High School.
Ownership History
Date
Name
Owned For
Owner Type
Purchase Details
Closed on
Jul 1, 2004
Sold by
Nelson Caren and Nelson Matthew F
Bought by
Knight John M and Knight Denise M
Current Estimated Value
Purchase Details
Closed on
May 25, 2001
Sold by
Nelson Matthew F and Nelson Caren
Bought by
Knight John M and Knight Denise M
Home Financials for this Owner
Home Financials are based on the most recent Mortgage that was taken out on this home.
Original Mortgage
$178,500
Interest Rate
7.15%
Mortgage Type
VA
Purchase Details
Closed on
Dec 28, 1998
Sold by
Nelson Matthew F and Nelson Caren
Bought by
Nelson Matthew F and Nelson Caren
Home Financials for this Owner
Home Financials are based on the most recent Mortgage that was taken out on this home.
Original Mortgage
$172,000
Interest Rate
6.4%
Purchase Details
Closed on
Jan 29, 1998
Sold by
Nelson Matthew F and Nelson Caren
Bought by
Nelson Matthew F and Nelson Caren
Create a Home Valuation Report for This Property
The Home Valuation Report is an in-depth analysis detailing your home's value as well as a comparison with similar homes in the area
Purchase History
| Date | Buyer | Sale Price | Title Company |
|---|---|---|---|
| Knight John M | -- | First American Title Co | |
| Knight John M | -- | Associated Title Company | |
| Nelson Matthew F | -- | Backman Stewart Title Servic | |
| Nelson Matthew F | -- | Backman Stewart Title Servic | |
| Nelson Matthew F | -- | -- |
Source: Public Records
Mortgage History
| Date | Status | Borrower | Loan Amount |
|---|---|---|---|
| Previous Owner | Knight John M | $178,500 | |
| Previous Owner | Nelson Matthew F | $172,000 |
Source: Public Records
Tax History
| Year | Tax Paid | Tax Assessment Tax Assessment Total Assessment is a certain percentage of the fair market value that is determined by local assessors to be the total taxable value of land and additions on the property. | Land | Improvement |
|---|---|---|---|---|
| 2025 | $214 | $282,151 | $120,786 | $161,365 |
| 2024 | $146 | $272,800 | $104,705 | $168,095 |
| 2023 | $135 | $476,000 | $195,652 | $280,348 |
| 2022 | $175 | $259,600 | $107,658 | $151,942 |
| 2021 | $129 | $358,000 | $140,764 | $217,236 |
| 2020 | $262 | $317,000 | $121,260 | $195,740 |
| 2019 | $295 | $316,000 | $135,195 | $180,805 |
| 2018 | $162 | $289,000 | $132,691 | $156,309 |
| 2016 | $112 | $135,080 | $41,313 | $93,767 |
| 2015 | $1,767 | $126,335 | $41,313 | $85,022 |
| 2014 | $102 | $132,325 | $41,313 | $91,012 |
| 2013 | -- | $125,475 | $48,029 | $77,446 |
Source: Public Records
Map
Nearby Homes
- 380 E 1500 S
- 288 E 1650 S
- 631 E 1700 S
- 1886 S Jeri Dr
- 1761 S Davis Blvd
- 141 E 1650 S
- 2059 S 350 E Unit 6
- 2038 S 350 E Unit 3
- 295 E 2050 S Unit 1
- 795 Abby Ln Unit 5
- 2046 S 350 E Unit 4
- 2053 S 350 E Unit 7
- 296 E 2050 S Unit 2
- 775 E 1500 S
- 285 E 1100 S
- 188 E 2050 S Unit D3
- 320 E 2100 S
- 861 E Millbrook Way
- 2064 S Orchard Dr
- 1820 S 50 W
Your Personal Tour Guide
Ask me questions while you tour the home.