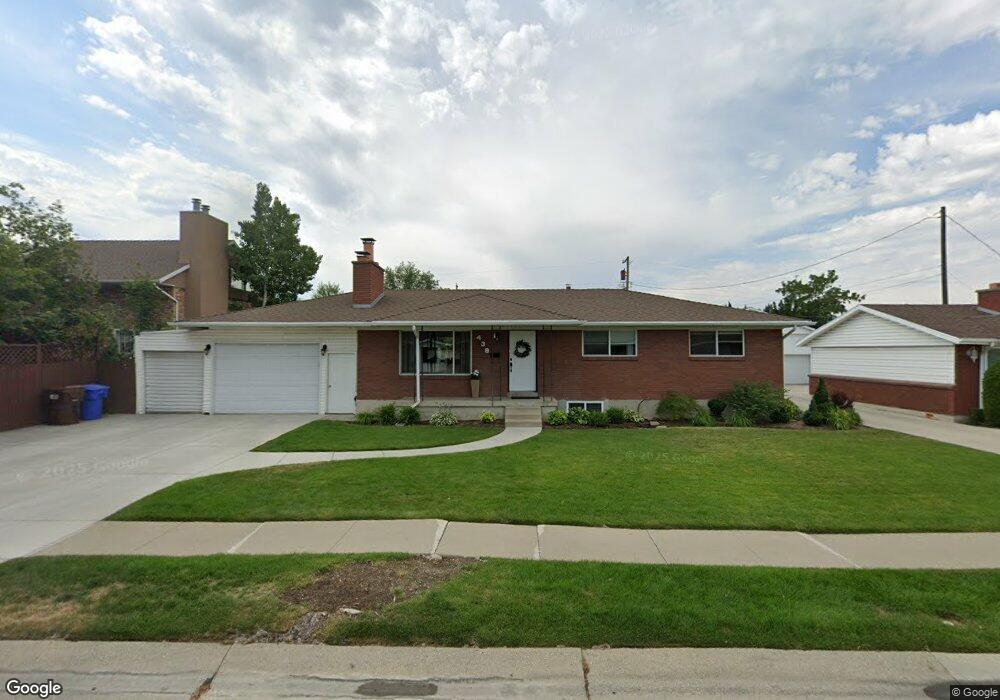
438 E 6865 S Midvale, UT 84047
Estimated Value: $567,599 - $625,000
3
Beds
3
Baths
1,514
Sq Ft
$394/Sq Ft
Est. Value
About This Home
This home is located at 438 E 6865 S, Midvale, UT 84047 and is currently estimated at $596,150, approximately $393 per square foot. 438 E 6865 S is a home located in Salt Lake County with nearby schools including East Midvale Elementary School, Hillcrest High School, and Midvale Middle School.
Ownership History
Date
Name
Owned For
Owner Type
Purchase Details
Closed on
Apr 21, 2021
Sold by
Lee Homer E
Bought by
Homer Randall S
Current Estimated Value
Purchase Details
Closed on
Apr 13, 2021
Sold by
Homer Randall S and E Lee And Gwen Home Family Tru
Bought by
Lord Debra K and Lord Michael R
Purchase Details
Closed on
Jul 31, 2009
Sold by
Homer Edmund L and Homer Gwen R
Bought by
Homer E Lee and Homer Gwen
Purchase Details
Closed on
Jul 8, 2009
Sold by
Homer Gwen
Bought by
Homer E Lee and Homer Gwen
Purchase Details
Closed on
Apr 23, 1999
Sold by
Homer Edmund L and Homer Gwen R
Bought by
Homer Gwen and The Gwen Homer Revocable Trust
Create a Home Valuation Report for This Property
The Home Valuation Report is an in-depth analysis detailing your home's value as well as a comparison with similar homes in the area
Home Values in the Area
Average Home Value in this Area
Purchase History
| Date | Buyer | Sale Price | Title Company |
|---|---|---|---|
| Homer Randall S | -- | -- | |
| Lord Debra K | -- | Benchmark Title Ins Agcy | |
| Homer Randall S | -- | -- | |
| Homer E Lee | -- | None Available | |
| Homer E Lee | -- | None Available | |
| Homer Gwen | -- | -- |
Source: Public Records
Tax History
| Year | Tax Paid | Tax Assessment Tax Assessment Total Assessment is a certain percentage of the fair market value that is determined by local assessors to be the total taxable value of land and additions on the property. | Land | Improvement |
|---|---|---|---|---|
| 2025 | $2,994 | $514,200 | $175,600 | $338,600 |
| 2024 | $2,994 | $491,600 | $165,700 | $325,900 |
| 2023 | $2,994 | $433,700 | $157,600 | $276,100 |
| 2022 | $2,809 | $446,400 | $131,300 | $315,100 |
| 2021 | $2,541 | $345,200 | $121,200 | $224,000 |
| 2020 | $2,444 | $314,200 | $99,600 | $214,600 |
| 2019 | $2,325 | $291,300 | $93,900 | $197,400 |
| 2018 | $0 | $270,800 | $93,900 | $176,900 |
| 2017 | $2,113 | $257,300 | $93,900 | $163,400 |
| 2016 | $2,026 | $239,300 | $93,900 | $145,400 |
| 2015 | $1,804 | $209,400 | $92,100 | $117,300 |
| 2014 | -- | $208,300 | $93,000 | $115,300 |
Source: Public Records
Map
Nearby Homes
- 512 E Larchwood Dr
- 7033 S 300 E
- 7045 S 300 E
- 6874 S 595 E Unit 66
- 283 E Vaughn Ln Unit 12
- 6717 S Vaughn Ln Unit 9
- 6718 S Vaughn Ln Unit 21
- 6720 S Vaughn Ln Unit 20
- 6715 S Vaughn Ln Unit 8
- 6716 S Vaughn Ln Unit 22
- 6714 S Vaughn Ln Unit 23
- 7187 S 420 E
- 7097 S 230 E
- 195 E 7060 S
- 6969 S Free Land Ave
- 7218 S Viansa Ct
- 529 E 7215 S Unit 9
- 6965 S 700 E
- 7083 Village Place
- 7230 S 525 E Unit A
Your Personal Tour Guide
Ask me questions while you tour the home.