438 E Elm St Sycamore, IL 60178
Estimated Value: $191,000 - $219,817
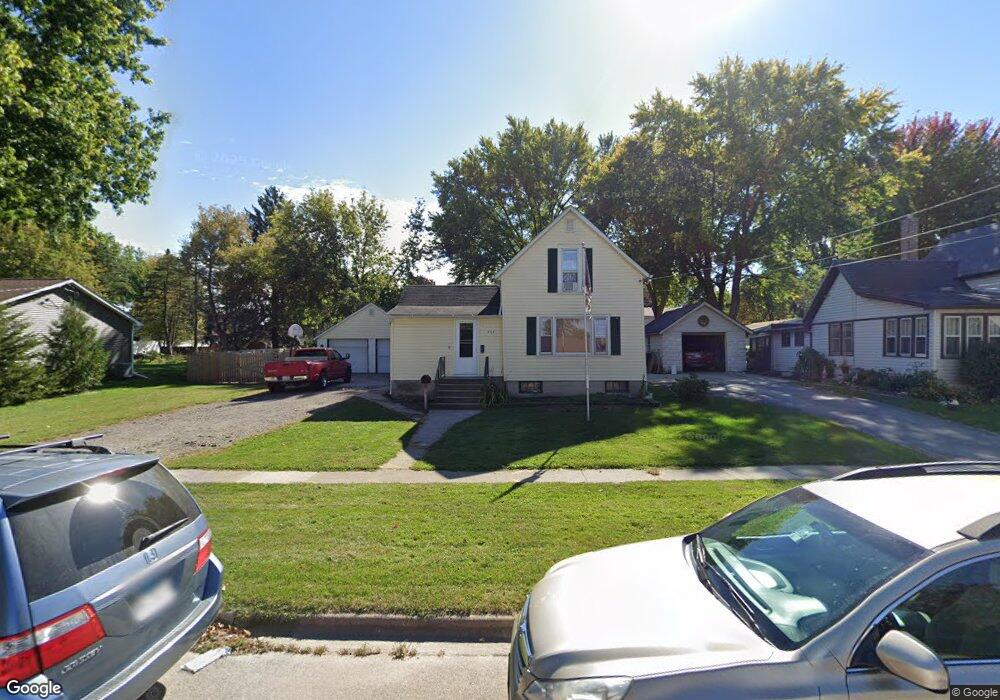
About This Home
This home is located at 438 E Elm St, Sycamore, IL 60178 and is currently estimated at $208,704, approximately $191 per square foot. 438 E Elm St is a home located in DeKalb County with nearby schools including Sycamore High School, St Mary's Catholic School, and Cornerstone Christian Academy.
Ownership History
We collect this data history from publicly available records. To have your information removed, we recommend requesting removal directly through your county’s website.
Purchase Details
Home Financials for this Owner
Home Financials are based on the most recent Mortgage that was taken out on this home.Purchase Details
Home Financials for this Owner
Home Financials are based on the most recent Mortgage that was taken out on this home.Home Values in the Area
Average Home Value in this Area
Purchase History
We collect this data history from publicly available records. To have your information removed, we recommend requesting removal directly through your county’s website.
| Date | Buyer | Sale Price | Title Company |
|---|---|---|---|
| $128,000 | None Listed On Document | ||
| $100,000 | None Available |
Mortgage History
We collect this data history from publicly available records. To have your information removed, we recommend requesting removal directly through your county’s website.
| Date | Status | Borrower | Loan Amount |
|---|---|---|---|
| Open | $126,400 | ||
| Previous Owner | $90,000 |
Tax History
We collect this data history from publicly available records. To have your information removed, we recommend requesting removal directly through your county’s website.
| Year | Tax Paid | Tax Assessment Tax Assessment Total Assessment is a certain percentage of the fair market value that is determined by local assessors to be the total taxable value of land and additions on the property. | Land | Improvement |
|---|---|---|---|---|
| 2025 | $3,990 | $57,419 | $17,331 | $40,088 |
| 2024 | $3,917 | $53,986 | $16,295 | $37,691 |
| 2023 | $3,716 | $49,298 | $14,880 | $34,418 |
| 2022 | $3,716 | $45,215 | $13,648 | $31,567 |
| 2021 | $3,517 | $42,448 | $12,813 | $29,635 |
| 2020 | $4,045 | $41,405 | $12,498 | $28,907 |
| 2019 | $3,986 | $40,498 | $12,224 | $28,274 |
| 2018 | $3,927 | $39,269 | $11,853 | $27,416 |
| 2017 | $3,842 | $37,715 | $11,384 | $26,331 |
| 2016 | $3,763 | $35,995 | $10,865 | $25,130 |
| 2015 | -- | $33,878 | $10,226 | $23,652 |
| 2014 | -- | $32,169 | $9,710 | $22,459 |
| 2013 | -- | $32,785 | $9,896 | $22,889 |
Map
- 525 E High St
- 338 Terrace Dr
- 320 E High St
- 230 Sabin St
- 415 Parkside Dr
- 230 E Elm St
- 506 Parkside Dr
- 406 S Locust St
- Lot 1 Route 23
- 418 Fairway Ln
- 927 Juniper Dr
- 932 Juniper Dr
- 605 Independence Ave
- 171 Mclaren Dr N Unit 6B
- 412 W High St
- 405 W High St
- 924 S Locust St
- 1008 Nottingham Rd
- 718 Independence Ave
- 1024 Nottingham Rd
Ask me questions while you tour the home.