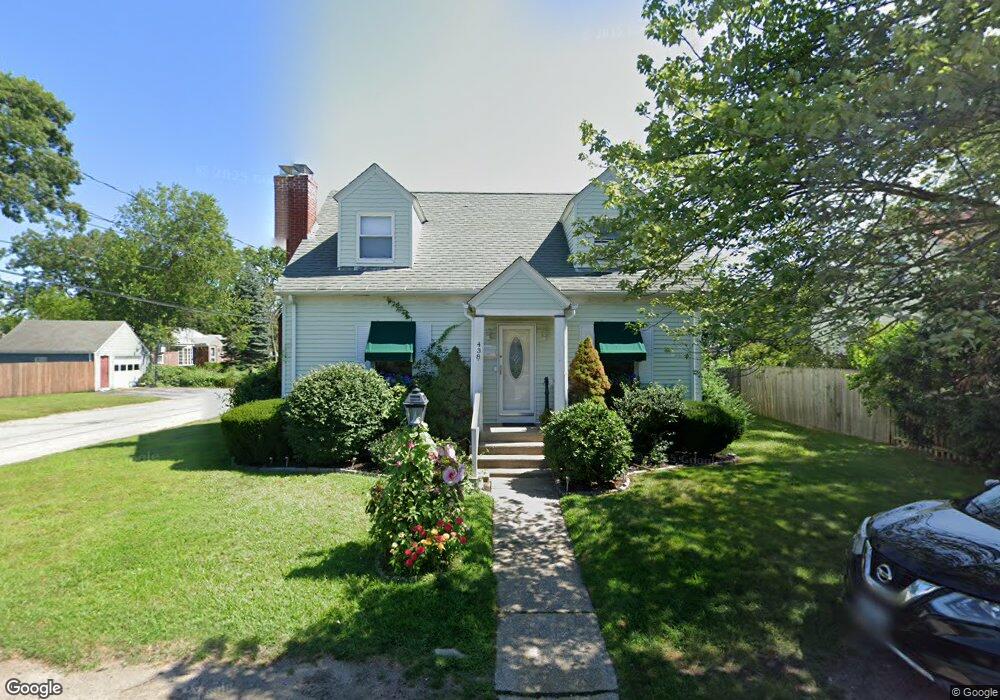
438 Elm St Warwick, RI 02888
Norwood NeighborhoodEstimated Value: $400,000 - $445,000
3
Beds
2
Baths
1,248
Sq Ft
$334/Sq Ft
Est. Value
About This Home
This home is located at 438 Elm St, Warwick, RI 02888 and is currently estimated at $417,434, approximately $334 per square foot. 438 Elm St is a home located in Kent County with nearby schools including Nel/Cps Construction Career, St. Peter School, and Saint Paul School.
Ownership History
Date
Name
Owned For
Owner Type
Purchase Details
Closed on
Nov 30, 2022
Sold by
Chase Thomas A and Chase Diane K
Bought by
Chase Allen T
Current Estimated Value
Home Financials for this Owner
Home Financials are based on the most recent Mortgage that was taken out on this home.
Original Mortgage
$325,600
Outstanding Balance
$315,175
Interest Rate
6.95%
Mortgage Type
FHA
Estimated Equity
$102,259
Create a Home Valuation Report for This Property
The Home Valuation Report is an in-depth analysis detailing your home's value as well as a comparison with similar homes in the area
Home Values in the Area
Average Home Value in this Area
Purchase History
| Date | Buyer | Sale Price | Title Company |
|---|---|---|---|
| Chase Allen T | $360,000 | None Available |
Source: Public Records
Mortgage History
| Date | Status | Borrower | Loan Amount |
|---|---|---|---|
| Open | Chase Allen T | $325,600 |
Source: Public Records
Tax History
| Year | Tax Paid | Tax Assessment Tax Assessment Total Assessment is a certain percentage of the fair market value that is determined by local assessors to be the total taxable value of land and additions on the property. | Land | Improvement |
|---|---|---|---|---|
| 2025 | $4,450 | $350,400 | $101,100 | $249,300 |
| 2024 | $4,221 | $291,700 | $87,900 | $203,800 |
| 2023 | $4,139 | $291,700 | $87,900 | $203,800 |
| 2022 | $3,954 | $211,100 | $56,900 | $154,200 |
| 2021 | $3,954 | $211,100 | $56,900 | $154,200 |
| 2020 | $3,954 | $211,100 | $56,900 | $154,200 |
| 2019 | $3,954 | $211,100 | $56,900 | $154,200 |
| 2018 | $3,003 | $175,700 | $56,900 | $118,800 |
| 2017 | $3,556 | $175,700 | $56,900 | $118,800 |
| 2016 | $3,556 | $175,700 | $56,900 | $118,800 |
| 2015 | $3,256 | $156,900 | $55,800 | $101,100 |
| 2014 | $3,147 | $156,900 | $55,800 | $101,100 |
| 2013 | $3,105 | $156,900 | $55,800 | $101,100 |
Source: Public Records
Map
Nearby Homes
- 175 Pettaconsett Ave
- 27 Frederick St
- 22 Phillips Ave
- 1052 Post Rd
- 35 Welfare Ave
- 90 Massachusetts Ave
- 77 Kentucky Ave
- 213 Easton Ave
- 123 Harrington Ave
- 0 Elmwood Ave
- 39 Holiday Ave
- 821 Post Rd
- 80 George St
- 15 Christopher Rhodes Way
- 6 Christopher Rhodes Way
- 20 Commodore Ave
- 136 Sherwood Ave
- 120 Sherwood Ave
- 127 Sherwood Ave
- 111 Sherwood Ave
Your Personal Tour Guide
Ask me questions while you tour the home.