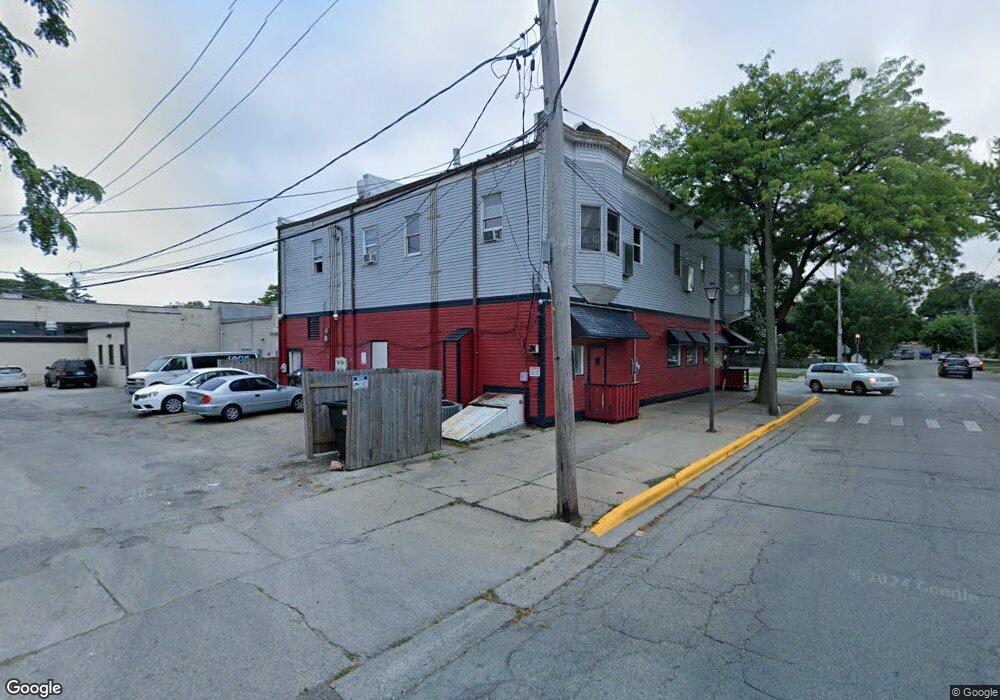
438 Franklin St Waukegan, IL 60085
Estimated Value: $340,721
--
Bed
--
Bath
5,880
Sq Ft
$58/Sq Ft
Est. Value
About This Home
This home is located at 438 Franklin St, Waukegan, IL 60085 and is currently estimated at $340,721, approximately $57 per square foot. 438 Franklin St is a home located in Lake County with nearby schools including Edith M Smith Middle School, Waukegan High School, and LEARN John & Kathy Schreiber Campus.
Ownership History
Date
Name
Owned For
Owner Type
Purchase Details
Closed on
Dec 18, 2024
Sold by
Forever Construction Inc
Bought by
Zoller Investments Llc
Current Estimated Value
Home Financials for this Owner
Home Financials are based on the most recent Mortgage that was taken out on this home.
Original Mortgage
$285,000
Outstanding Balance
$282,715
Interest Rate
6.69%
Mortgage Type
Credit Line Revolving
Estimated Equity
$58,006
Purchase Details
Closed on
May 5, 2005
Sold by
Al Mini Enterprises Inc
Bought by
Forever Construction Inc
Purchase Details
Closed on
Dec 21, 2004
Sold by
Illinois Carbide Tool Co
Bought by
Al Mini Enterprises Inc
Create a Home Valuation Report for This Property
The Home Valuation Report is an in-depth analysis detailing your home's value as well as a comparison with similar homes in the area
Home Values in the Area
Average Home Value in this Area
Purchase History
| Date | Buyer | Sale Price | Title Company |
|---|---|---|---|
| Zoller Investments Llc | $315,000 | None Listed On Document | |
| Zoller Investments Llc | $315,000 | None Listed On Document | |
| Forever Construction Inc | $227,000 | -- | |
| Al Mini Enterprises Inc | -- | -- |
Source: Public Records
Mortgage History
| Date | Status | Borrower | Loan Amount |
|---|---|---|---|
| Open | Zoller Investments Llc | $285,000 | |
| Closed | Zoller Investments Llc | $285,000 |
Source: Public Records
Tax History Compared to Growth
Tax History
| Year | Tax Paid | Tax Assessment Tax Assessment Total Assessment is a certain percentage of the fair market value that is determined by local assessors to be the total taxable value of land and additions on the property. | Land | Improvement |
|---|---|---|---|---|
| 2024 | $9,071 | $100,615 | $4,880 | $95,735 |
| 2023 | $9,295 | $96,203 | $4,666 | $91,537 |
| 2022 | $9,295 | $95,075 | $4,444 | $90,631 |
| 2021 | $9,826 | $94,245 | $4,405 | $89,840 |
| 2020 | $9,953 | $87,801 | $4,104 | $83,697 |
| 2019 | $10,017 | $80,456 | $3,761 | $76,695 |
| 2018 | $10,259 | $79,346 | $3,709 | $75,637 |
| 2017 | $9,986 | $70,199 | $3,281 | $66,918 |
| 2016 | $9,426 | $61,000 | $2,851 | $58,149 |
| 2015 | $9,223 | $54,596 | $2,552 | $52,044 |
| 2014 | $9,354 | $55,287 | $2,584 | $52,703 |
| 2012 | $10,911 | $59,898 | $2,800 | $57,098 |
Source: Public Records
Map
Nearby Homes
- 438 Franklin St Unit C
- 438 Franklin St Unit A
- 436 Franklin St
- 434 Franklin St
- 609 North Ave Unit GARAGE
- 609 North Ave Unit 1F
- 609 North Ave Unit 1R
- 609 North Ave Unit 2R
- 609 North Ave Unit 2F
- 609 North Ave
- 611 North Ave
- 433 Franklin St
- 606 North Ave
- 431 Franklin St
- 615 North Ave
- 602 North Ave
- 427 Franklin St
- 523 North Ave
- 530 North Ave
- 425 Franklin St