B
Seller's Agent in 2012
Barbara Watkins
Realty Solutions Inc.
(781) 789-5447
24 Total Sales
Estimated Value: $822,952 - $908,000
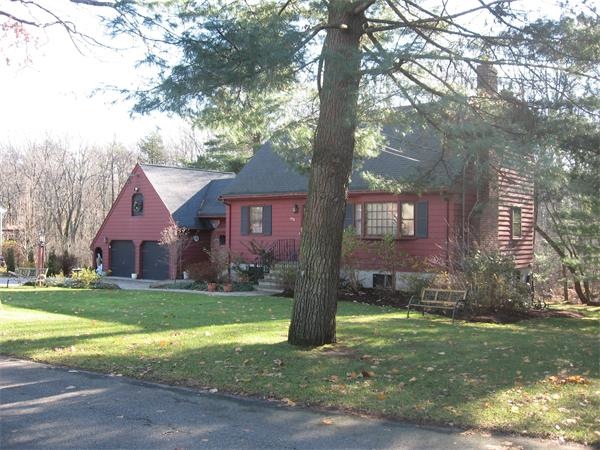
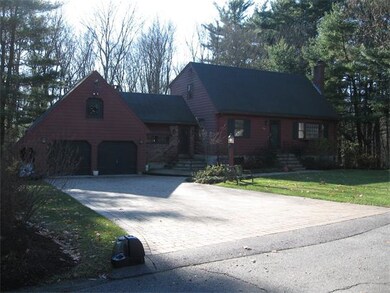
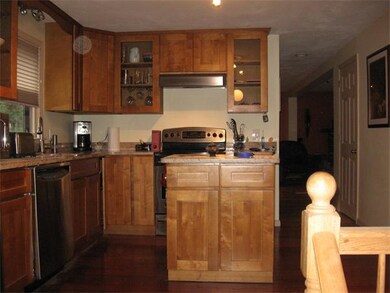
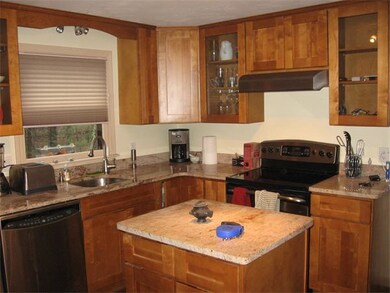
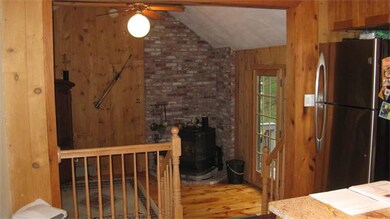
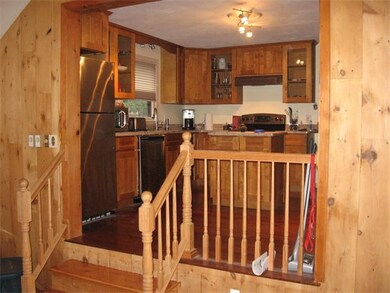
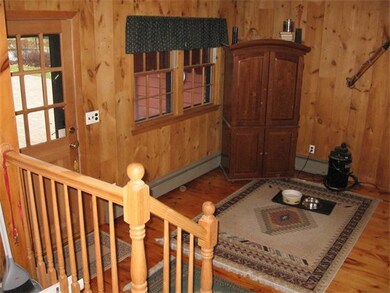
Updated Cape in super neighborhood. (past C.Club side of Grove)Newer kitchen, hardwood fls, over sized Living rm plus beautiful 1st floor family rm. Updated elect.,new composite deck,new driveway, steps & walks professionally done in pavers.1st floor bedroom walls removed to make part of the livingrm could easily put back.Is 2 beds now. Private yard. 2 full baths one has whirlpool tub. Basement could be finished.Lofted area over 2car garage could also be finished &accessed from fam.rm
| Date | Buyer | Sale Price | Title Company |
|---|---|---|---|
| Barker Albert J | -- | -- |
| Date | Event | Price | List to Sale | Price per Sq Ft |
|---|---|---|---|---|
| 11/15/2012 11/15/12 | Sold | $418,500 | -2.7% | $258 / Sq Ft |
| 11/05/2012 11/05/12 | Pending | -- | -- | -- |
| 09/15/2012 09/15/12 | Price Changed | $429,900 | -1.1% | $265 / Sq Ft |
| 07/27/2012 07/27/12 | Price Changed | $434,888 | 0.0% | $268 / Sq Ft |
| 06/21/2012 06/21/12 | Price Changed | $434,999 | -4.4% | $268 / Sq Ft |
| 06/20/2012 06/20/12 | For Sale | $454,999 | +8.7% | $280 / Sq Ft |
| 06/15/2012 06/15/12 | Off Market | $418,500 | -- | -- |
| 01/11/2012 01/11/12 | Price Changed | $454,999 | -3.2% | $280 / Sq Ft |
| 11/25/2011 11/25/11 | For Sale | $469,999 | -- | $289 / Sq Ft |
| Year | Tax Paid | Tax Assessment Tax Assessment Total Assessment is a certain percentage of the fair market value that is determined by local assessors to be the total taxable value of land and additions on the property. | Land | Improvement |
|---|---|---|---|---|
| 2025 | $9,046 | $794,200 | $476,300 | $317,900 |
| 2024 | $8,941 | $762,900 | $457,500 | $305,400 |
| 2023 | $8,661 | $687,900 | $412,500 | $275,400 |
| 2022 | $8,337 | $625,400 | $375,000 | $250,400 |
| 2021 | $8,200 | $593,800 | $359,400 | $234,400 |
| 2020 | $7,883 | $565,100 | $342,000 | $223,100 |
| 2019 | $7,659 | $538,200 | $325,700 | $212,500 |
| 2018 | $7,673 | $507,600 | $307,200 | $200,400 |
| 2017 | $6,719 | $478,900 | $289,800 | $189,100 |
| 2016 | $6,323 | $436,100 | $259,700 | $176,400 |
| 2015 | $5,924 | $403,000 | $240,000 | $163,000 |
| 2014 | $5,738 | $389,300 | $231,800 | $157,500 |
B
Seller's Agent in 2012
Barbara Watkins
Realty Solutions Inc.
(781) 789-5447
24 Total Sales
E
Buyer's Agent in 2012
Elizabeth Stakem
Leading Edge Real Estate
31 in this area
36 Total Sales
Source: MLS Property Information Network (MLS PIN)
MLS Number: 71314224
APN: READ-000043-000000-000010
Disclaimer: Certain information contained herein is derived from information provided by parties other than Homes.com. All information provided is deemed reliable, but is not guaranteed to be accurate and should be independently verified.
![]() The property listing data and information, or the Images, set forth herein were provided to MLS Property Information Network, Inc. from third party sources, including sellers, lessors and public records, and were compiled by MLS Property Information Network, Inc. The property listing data and information, and the Images, are for the personal, non-commercial use of consumers having a good faith interest in purchasing or leasing listed properties of the type displayed to them and may not be used for any purpose other than to identify prospective properties which such consumers may have a good faith interest in purchasing or leasing. MLS Property Information Network, Inc. and its subscribers disclaim any and all representations and warranties as to the accuracy of the property listing data and information, or as to the accuracy of any of the Images, set forth herein.
The property listing data and information, or the Images, set forth herein were provided to MLS Property Information Network, Inc. from third party sources, including sellers, lessors and public records, and were compiled by MLS Property Information Network, Inc. The property listing data and information, and the Images, are for the personal, non-commercial use of consumers having a good faith interest in purchasing or leasing listed properties of the type displayed to them and may not be used for any purpose other than to identify prospective properties which such consumers may have a good faith interest in purchasing or leasing. MLS Property Information Network, Inc. and its subscribers disclaim any and all representations and warranties as to the accuracy of the property listing data and information, or as to the accuracy of any of the Images, set forth herein.
Ask me questions while you tour the home.
