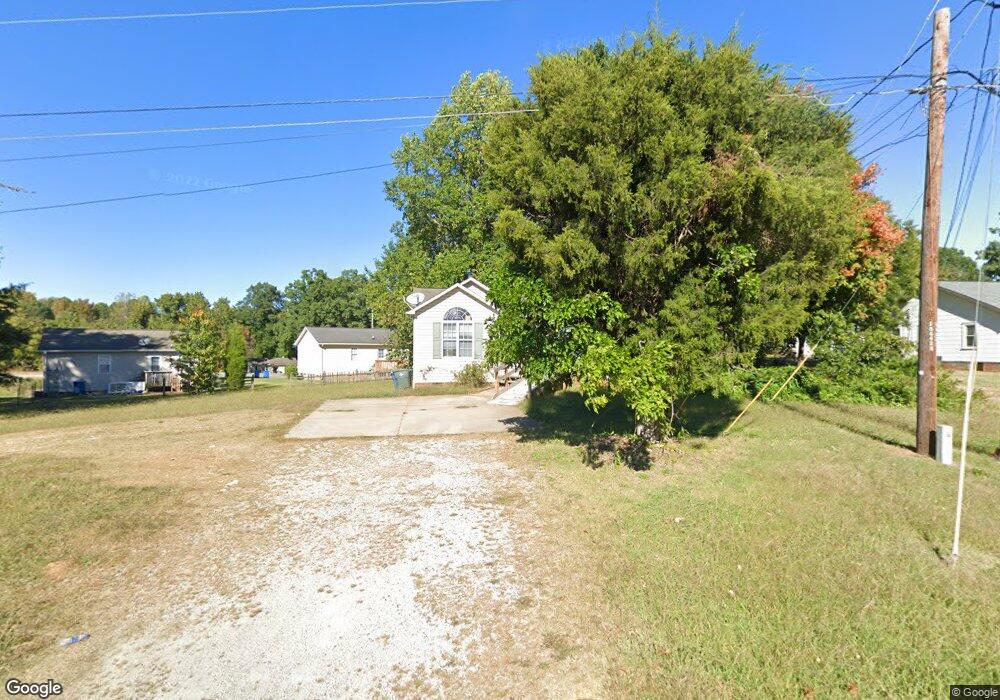
438 Morlan Park Rd Salisbury, NC 28146
Estimated Value: $158,000 - $197,000
Studio
2
Baths
768
Sq Ft
$229/Sq Ft
Est. Value
About This Home
This home is located at 438 Morlan Park Rd, Salisbury, NC 28146 and is currently estimated at $175,711, approximately $228 per square foot. 438 Morlan Park Rd is a home located in Rowan County with nearby schools including Granite Quarry Elementary School, Charles C Erwin Middle School, and East Rowan High School.
Ownership History
Date
Name
Owned For
Owner Type
Purchase Details
Closed on
Apr 26, 2011
Sold by
Eddie Hampton Investment Properties Llc
Bought by
Query Investment Properties Llc
Current Estimated Value
Home Financials for this Owner
Home Financials are based on the most recent Mortgage that was taken out on this home.
Original Mortgage
$54,800
Outstanding Balance
$38,031
Interest Rate
4.85%
Mortgage Type
Unknown
Estimated Equity
$137,680
Purchase Details
Closed on
Mar 4, 2010
Sold by
Salisbury Investment Properties Llc
Bought by
Eddie Hampton Investment Properties Llc
Purchase Details
Closed on
Sep 12, 2005
Sold by
Salisbury Investment Properties Llc
Bought by
Salisbury Investment Properties Llc
Home Financials for this Owner
Home Financials are based on the most recent Mortgage that was taken out on this home.
Original Mortgage
$200,000
Interest Rate
5.86%
Mortgage Type
Fannie Mae Freddie Mac
Create a Home Valuation Report for This Property
The Home Valuation Report is an in-depth analysis detailing your home's value as well as a comparison with similar homes in the area
Home Values in the Area
Average Home Value in this Area
Purchase History
| Date | Buyer | Sale Price | Title Company |
|---|---|---|---|
| Query Investment Properties Llc | $68,500 | None Available | |
| Eddie Hampton Investment Properties Llc | -- | None Available | |
| Salisbury Investment Properties Llc | -- | -- |
Source: Public Records
Mortgage History
| Date | Status | Borrower | Loan Amount |
|---|---|---|---|
| Open | Query Investment Properties Llc | $54,800 | |
| Previous Owner | Salisbury Investment Properties Llc | $200,000 |
Source: Public Records
Tax History
| Year | Tax Paid | Tax Assessment Tax Assessment Total Assessment is a certain percentage of the fair market value that is determined by local assessors to be the total taxable value of land and additions on the property. | Land | Improvement |
|---|---|---|---|---|
| 2025 | $1,275 | $106,590 | $19,219 | $87,371 |
| 2024 | $1,275 | $106,590 | $19,219 | $87,371 |
| 2023 | $1,275 | $106,590 | $19,219 | $87,371 |
| 2022 | $943 | $68,459 | $13,261 | $55,198 |
| 2021 | $943 | $68,459 | $13,261 | $55,198 |
| 2020 | $943 | $68,459 | $13,261 | $55,198 |
| 2019 | $943 | $68,459 | $13,261 | $55,198 |
| 2018 | $785 | $57,786 | $13,222 | $44,564 |
| 2017 | $781 | $57,786 | $13,222 | $44,564 |
| 2016 | $760 | $57,786 | $13,222 | $44,564 |
| 2015 | $764 | $57,786 | $13,222 | $44,564 |
| 2014 | $755 | $57,786 | $13,222 | $44,564 |
Source: Public Records
Map
Nearby Homes
- 1211 Tower Dr
- 301 Gold Hill Dr
- 2540 Jake Alexander Blvd S
- 2530 Jake Alexander Blvd S Unit 1
- 208 Stone Ridge Dr
- 1416 Jake Alexander Blvd S
- 215 Craver Ave
- 204 Morlan Park Rd
- 1207 Oak Haven Dr
- 122 Stone Ridge Dr Unit 8
- 0 Old Concord Rd Unit 10094451
- 2315 Berkshire Dr
- 507 Oak Brook Dr
- 106 Birmingham Place
- 0 Harrel St
- 407 Oak Forest Ln
- 107 Prestwick Ct
- 1920 Baker Ct
- 220 Wildwood Dr
- 201 Eastwood Dr Unit 401
- 1915 Jake Alexander Blvd S
- 1919 Jake Alexander Blvd S
- 1911 Jake Alexander Blvd S
- 436 Morlan Park Rd
- 1923 Jake Alexander Blvd S
- 1929 Jake Alexander Blvd S
- 442 Morlan Park Rd
- 0 Pearl St
- 2001 Jake Alexander Blvd S
- 434 Morlan Park Rd
- 432 Morlan Park Rd
- 2007 Jake Alexander Blvd S
- 1920 Jake Alexander Blvd W
- 1920 Jake Alexander Blvd S
- 1920 Jake Alexander Blvd S
- 428 Morlan Park Rd
- 2015 Jake Alexander Blvd S
- 1926 Jake Alexander Blvd S
- 826 Crown Point Dr
- 2010 Jake Alexander Blvd S
Your Personal Tour Guide
Ask me questions while you tour the home.