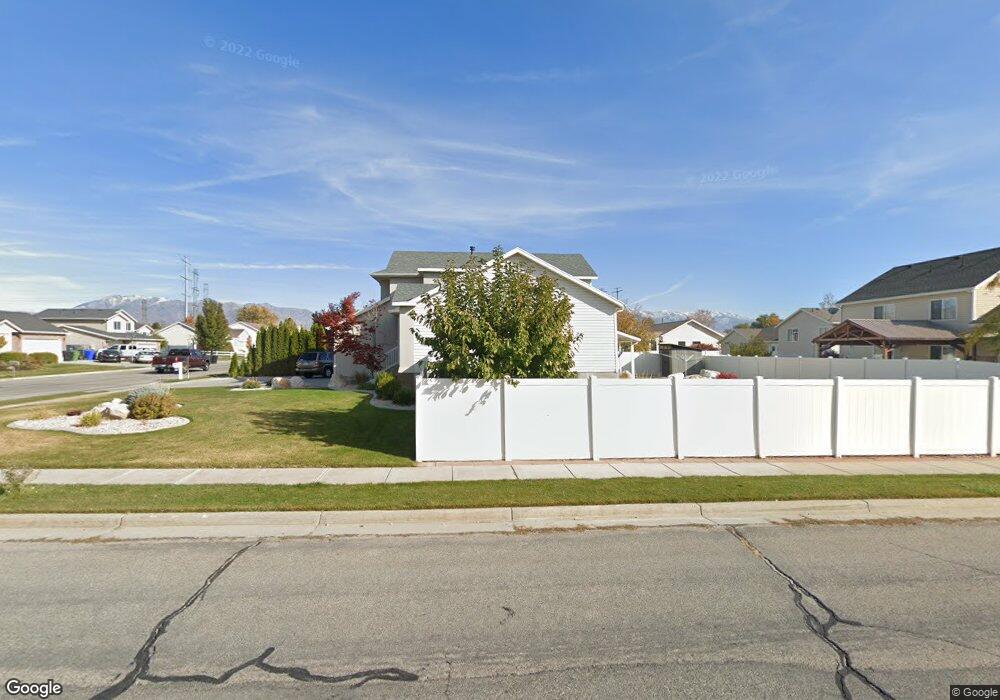
438 N 1750 W Unit Lot 15 West Point, UT 84015
Estimated Value: $486,000 - $526,000
3
Beds
2
Baths
2,130
Sq Ft
$237/Sq Ft
Est. Value
About This Home
This home is located at 438 N 1750 W Unit Lot 15, West Point, UT 84015 and is currently estimated at $504,133, approximately $236 per square foot. 438 N 1750 W Unit Lot 15 is a home located in Davis County with nearby schools including Lakeside School, West Point Junior High School, and Syracuse High School.
Ownership History
Date
Name
Owned For
Owner Type
Purchase Details
Closed on
May 1, 2005
Sold by
Weisman Patricia
Bought by
Gallagher Patrick B and Gallagher Christa
Current Estimated Value
Home Financials for this Owner
Home Financials are based on the most recent Mortgage that was taken out on this home.
Original Mortgage
$170,000
Outstanding Balance
$87,097
Interest Rate
5.77%
Mortgage Type
New Conventional
Estimated Equity
$417,036
Purchase Details
Closed on
Mar 30, 2005
Sold by
Weismann Michael Shane
Bought by
Gallaher Patrick B and Gallaher Christa
Home Financials for this Owner
Home Financials are based on the most recent Mortgage that was taken out on this home.
Original Mortgage
$170,000
Outstanding Balance
$87,097
Interest Rate
5.77%
Mortgage Type
New Conventional
Estimated Equity
$417,036
Purchase Details
Closed on
Aug 28, 2002
Sold by
Farr Don R
Bought by
Weismann Michael Shane
Create a Home Valuation Report for This Property
The Home Valuation Report is an in-depth analysis detailing your home's value as well as a comparison with similar homes in the area
Home Values in the Area
Average Home Value in this Area
Purchase History
| Date | Buyer | Sale Price | Title Company |
|---|---|---|---|
| Gallagher Patrick B | -- | -- | |
| Gallaher Patrick B | -- | None Available | |
| Weismann Michael Shane | -- | Founders Title Co | |
| Weismann Michael Shane | -- | Equity Title Agency |
Source: Public Records
Mortgage History
| Date | Status | Borrower | Loan Amount |
|---|---|---|---|
| Open | Gallaher Patrick B | $170,000 |
Source: Public Records
Tax History Compared to Growth
Tax History
| Year | Tax Paid | Tax Assessment Tax Assessment Total Assessment is a certain percentage of the fair market value that is determined by local assessors to be the total taxable value of land and additions on the property. | Land | Improvement |
|---|---|---|---|---|
| 2025 | $1,118 | $266,750 | $96,742 | $170,008 |
| 2024 | $1,118 | $256,849 | $87,147 | $169,702 |
| 2023 | $996 | $238,700 | $58,065 | $180,634 |
| 2022 | $1,800 | $465,000 | $98,331 | $366,669 |
| 2021 | $1,422 | $352,000 | $87,769 | $264,231 |
| 2020 | $1,092 | $301,000 | $73,129 | $227,871 |
| 2019 | $1,185 | $309,000 | $71,129 | $237,871 |
| 2018 | $1,000 | $278,000 | $72,469 | $205,531 |
| 2016 | $711 | $126,830 | $27,981 | $98,849 |
| 2015 | $1,752 | $118,800 | $27,981 | $90,819 |
| 2014 | $500 | $108,843 | $27,981 | $80,862 |
| 2013 | -- | $107,248 | $30,566 | $76,682 |
Source: Public Records
Map
Nearby Homes
- 1774 W 400 N
- 1652 W 560 N
- 1805 W 675 N
- 575 N 1350 W Unit 137
- 1832 W 725 N
- 1350 W 300 N Unit 49
- 1350 W 300 N Unit 38
- 1350 W 300 N Unit 29
- 1827 W 775 N
- 607 N 2000 W
- 563 N 1350 W Unit 139
- 1337 W 550 N Unit 195
- 47 N 1750 W
- 423 N 1250 W Unit 118
- 12 N 2000 W Unit 1
- 1828 W 75 S
- 417 N 1200 W Unit 84
- 1648 W 150 S
- 2132 W 800 N
- 16 N 1300 W
- 438 N 1750 W
- 1737 W 475 N Unit 15
- 1721 W 475 N
- 1738 W 400 N
- 1722 W 400 N
- 443 N 1750 W
- 427 N 1750 W
- 1699 W 475 N
- 1736 W 475 N
- 490 N 1750 W Unit Lot 18
- 1706 W 400 N
- 481 N 1750 W
- 411 N 1750 W
- 411 N 1750 W Unit LOT28
- 1702 W 475 N
- 1677 W 475 N
- 1677 W 475 N Unit 52
- 495 N 1750 W
- 395 N 1750 W
- 395 N 1750 W Unit Lot29