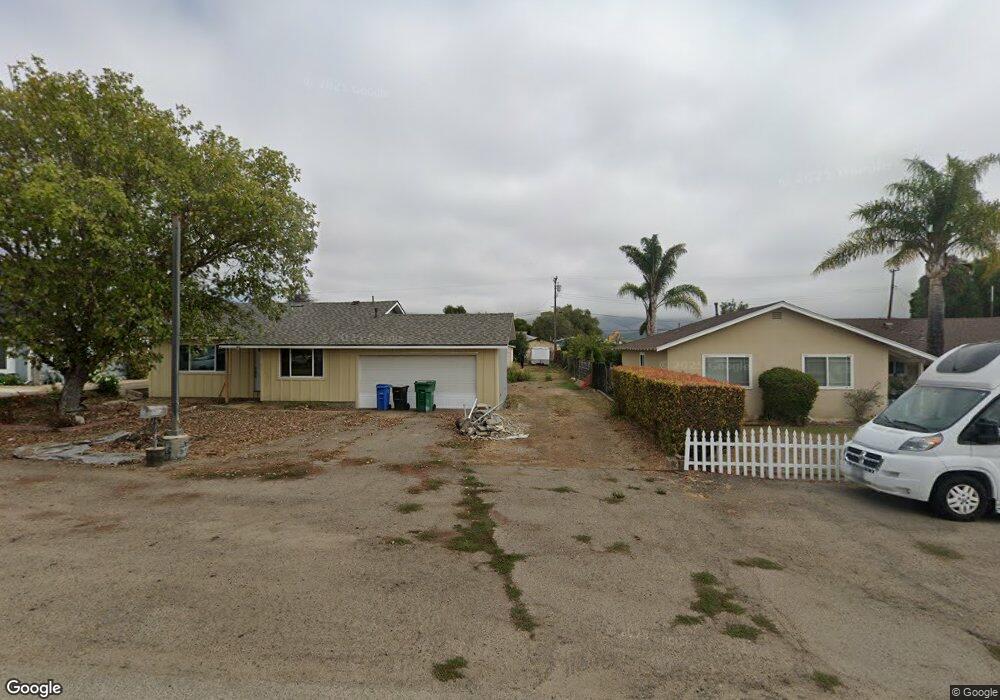
438 N Burton St Nipomo, CA 93444
Estimated Value: $293,000 - $707,000
3
Beds
1
Bath
1,020
Sq Ft
$518/Sq Ft
Est. Value
About This Home
This home is located at 438 N Burton St, Nipomo, CA 93444 and is currently estimated at $528,841, approximately $518 per square foot. 438 N Burton St is a home located in San Luis Obispo County with nearby schools including Nipomo Elementary School, Mesa Middle School, and Nipomo High School.
Ownership History
Date
Name
Owned For
Owner Type
Purchase Details
Closed on
Feb 9, 2023
Sold by
Louella Arellanes Trust
Bought by
Arellanes Nicholas C and Arellanes Louella
Current Estimated Value
Home Financials for this Owner
Home Financials are based on the most recent Mortgage that was taken out on this home.
Original Mortgage
$270,162
Outstanding Balance
$261,912
Interest Rate
6.48%
Mortgage Type
New Conventional
Estimated Equity
$266,929
Purchase Details
Closed on
Aug 23, 2021
Sold by
Arellanes Louella
Bought by
Arellanes Louella and Louella Arellanes Trust
Purchase Details
Closed on
Feb 4, 1998
Sold by
Arellanes Louella
Bought by
Arellanes Louella
Home Financials for this Owner
Home Financials are based on the most recent Mortgage that was taken out on this home.
Original Mortgage
$100,000
Interest Rate
6.95%
Create a Home Valuation Report for This Property
The Home Valuation Report is an in-depth analysis detailing your home's value as well as a comparison with similar homes in the area
Home Values in the Area
Average Home Value in this Area
Purchase History
We collect this data history from publicly available records. To have your information removed, we recommend requesting removal directly through your county’s website.
| Date | Buyer | Sale Price | Title Company |
|---|---|---|---|
| Arellanes Nicholas C | $267,500 | Amrock | |
| Arellanes Louella | -- | None Available | |
| Arellanes Louella | -- | Fidelity National Title Co |
Source: Public Records
Mortgage History
We collect this data history from publicly available records. To have your information removed, we recommend requesting removal directly through your county’s website.
| Date | Status | Borrower | Loan Amount |
|---|---|---|---|
| Open | Arellanes Nicholas C | $270,162 | |
| Previous Owner | Arellanes Louella | $100,000 |
Source: Public Records
Tax History
| Year | Tax Paid | Tax Assessment Tax Assessment Total Assessment is a certain percentage of the fair market value that is determined by local assessors to be the total taxable value of land and additions on the property. | Land | Improvement |
|---|---|---|---|---|
| 2025 | $2,844 | $283,525 | $189,367 | $94,158 |
| 2024 | $2,732 | $278,115 | $185,654 | $92,461 |
| 2023 | $2,732 | $265,212 | $182,014 | $83,198 |
| 2022 | $2,689 | $260,013 | $178,446 | $81,567 |
| 2021 | $2,683 | $254,916 | $174,948 | $79,968 |
| 2020 | $2,651 | $252,304 | $173,155 | $79,149 |
| 2019 | $2,633 | $247,358 | $169,760 | $77,598 |
| 2018 | $2,600 | $242,509 | $166,432 | $76,077 |
| 2017 | $2,550 | $237,755 | $163,169 | $74,586 |
| 2016 | $2,404 | $233,094 | $159,970 | $73,124 |
| 2015 | $2,368 | $229,594 | $157,568 | $72,026 |
| 2014 | $2,279 | $225,098 | $154,482 | $70,616 |
Source: Public Records
Map
Nearby Homes
- 400 N Oakglen Ave
- 150 E Chestnut St
- 182 E Chestnut St
- 205 W Tefft St
- 267 W Tefft St
- 285 E Tefft St
- 0 S Burton St
- 160 San Antonio Ln
- 449 W Tefft St Unit 41
- 230 Hans Place
- 228 Chaparral Ln
- 549 Hill St
- 181 Jerome Ct
- 680 Hill St
- 719 W Tefft St
- 778 Primrose Ln
- 525 Grande Ave
- 545 Grande St
- 215 Rancho Rd
- 187 Amaranth Ln
- 420 N Burton St
- 444 N Burton St
- 410 N Burton St
- 448 N Burton St
- 431 N Thompson Ave
- 423 N Thompson Ave
- 439 N Thompson Ave
- 144 Day St
- 130 Day St
- 415 N Burton St
- 415 N Thompson Ave
- 431 N Burton St
- 449 N Thompson Ave
- 437 N Burton St
- 423 N Burton St
- 120 Day St
- 447 N Burton St
- 110 Day St
- 156 Day St
- 168 Day St
Your Personal Tour Guide
Ask me questions while you tour the home.