Estimated Value: $240,383 - $315,000
3
Beds
2
Baths
1,903
Sq Ft
$145/Sq Ft
Est. Value
About This Home
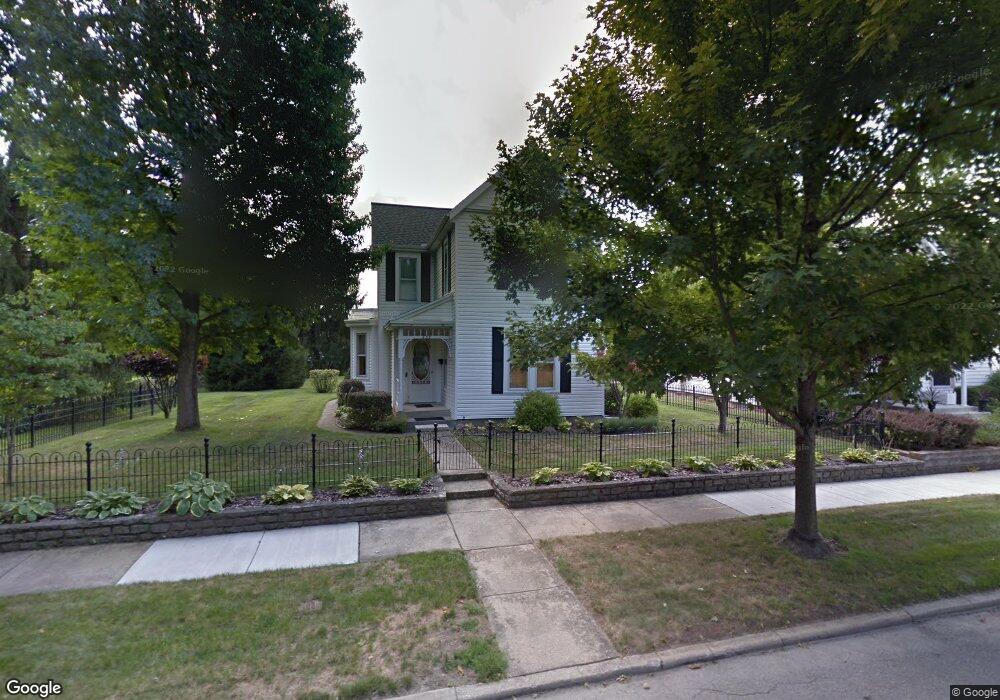
This home is located at 438 N Galloway St, Xenia, OH 45385 and is currently estimated at $276,346, approximately $145 per square foot. 438 N Galloway St is a home located in Greene County with nearby schools including Xenia High School, Summit Academy Community School for Alternative Learners - Xenia, and Legacy Christian Academy.
Ownership History
Date
Name
Owned For
Owner Type
Purchase Details
Closed on
Sep 5, 2002
Sold by
Pierson James D and Pierson Patricia A
Bought by
Pierson James D and Pierson Patricia A
Current Estimated Value
Purchase Details
Closed on
May 30, 1998
Sold by
Whalin Kelbert and Whalin Mary June
Bought by
Whalin Kelbert and Whalin Mary June
Create a Home Valuation Report for This Property
The Home Valuation Report is an in-depth analysis detailing your home's value as well as a comparison with similar homes in the area
Home Values in the Area
Average Home Value in this Area
Purchase History
| Date | Buyer | Sale Price | Title Company |
|---|---|---|---|
| Pierson James D | -- | -- | |
| Whalin Kelbert | -- | -- |
Source: Public Records
Tax History Compared to Growth
Tax History
| Year | Tax Paid | Tax Assessment Tax Assessment Total Assessment is a certain percentage of the fair market value that is determined by local assessors to be the total taxable value of land and additions on the property. | Land | Improvement |
|---|---|---|---|---|
| 2024 | $2,206 | $62,720 | $8,190 | $54,530 |
| 2023 | $2,206 | $62,720 | $8,190 | $54,530 |
| 2022 | $1,812 | $45,800 | $5,120 | $40,680 |
| 2021 | $1,836 | $45,800 | $5,120 | $40,680 |
| 2020 | $1,609 | $45,800 | $5,120 | $40,680 |
| 2019 | $1,609 | $40,670 | $5,050 | $35,620 |
| 2018 | $1,615 | $40,670 | $5,050 | $35,620 |
| 2017 | $1,641 | $40,670 | $5,050 | $35,620 |
| 2016 | $1,641 | $40,600 | $5,050 | $35,550 |
| 2015 | $694 | $40,600 | $5,050 | $35,550 |
| 2014 | $86 | $40,600 | $5,050 | $35,550 |
Source: Public Records
Map
Nearby Homes
- 450 N Galloway St
- 410 N Galloway St
- 460 N Galloway St
- 460 N Galloway St
- 226 Pleasant St
- 411 N Galloway St
- 451 N Galloway St
- 439 N West St
- 439 N Galloway St
- 431 N West St
- 449 N West St
- 231 Union St
- 459 N West St
- 386 N Galloway St
- 246 Pleasant St
- 469 N Galloway St
- 469 N Galloway St Unit 1/2
- 498 N Galloway St
- 147 Union St
- 227 Pleasant St