
Seller's Agent in 2025
Jackson Vanderpool
Windermere CRG
(360) 600-6997
34 Total Sales
Estimated Value: $666,000 - $703,000
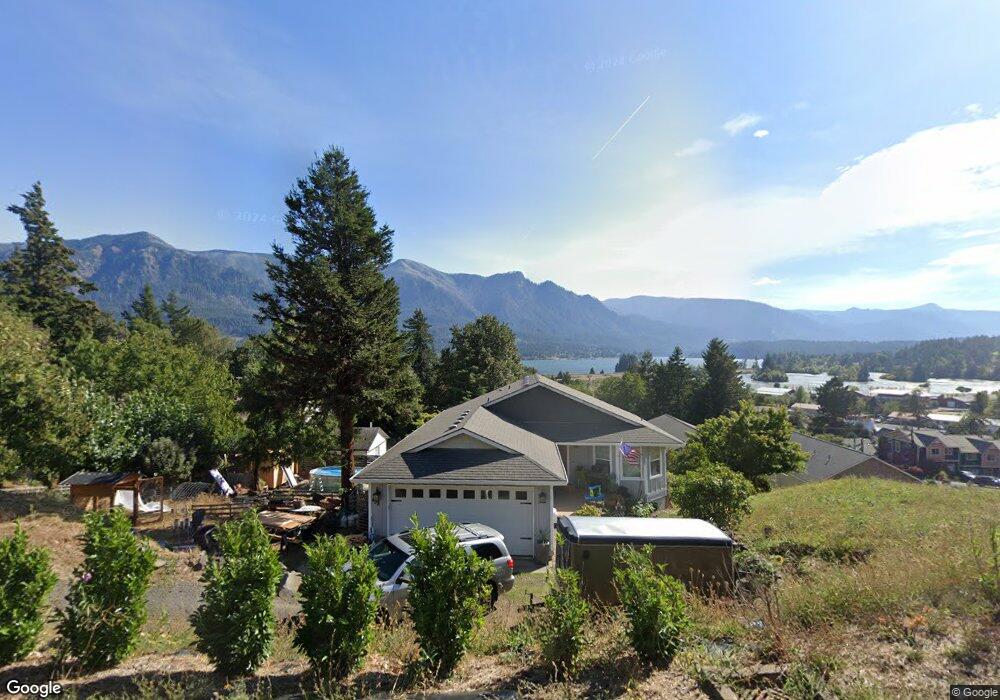
Beautiful 4 bedroom, 3 bath home with an amazing view of the Columbia River Gorge. The main floor has an open concept living room, kitchen and dining area, along with 2 bedrooms, 2 bathrooms, laundry room, office, 2 car garage and a south facing deck that provides a wonderful view of the Columbia River & Cascade Mountains. The daylight basement brings a family room, bathroom, 2 bedrooms, bonus room and large storage area. Outside there are two south facing decks and one north with mature landscaping all around the home and minimal area to maintain. The lot to the east is a separate parcel, that is also available for an additional $150,000. Listing agent is the owner and will not duel represent.
| Date | Buyer | Sale Price | Title Company |
|---|---|---|---|
| Vanderpool Jackson | $128,000 | None Available |
| Date | Status | Borrower | Loan Amount |
|---|---|---|---|
| Open | Vanderpool Jackson | $130,560 |
| Date | Event | Price | List to Sale | Price per Sq Ft |
|---|---|---|---|---|
| 12/03/2025 12/03/25 | Price Changed | $665,000 | -2.2% | $278 / Sq Ft |
| 10/17/2025 10/17/25 | Price Changed | $680,000 | -2.7% | $285 / Sq Ft |
| 09/04/2025 09/04/25 | Price Changed | $699,000 | -3.6% | $293 / Sq Ft |
| 08/13/2025 08/13/25 | For Sale | $725,000 | -- | $304 / Sq Ft |
| Year | Tax Paid | Tax Assessment Tax Assessment Total Assessment is a certain percentage of the fair market value that is determined by local assessors to be the total taxable value of land and additions on the property. | Land | Improvement |
|---|---|---|---|---|
| 2025 | $4,510 | $559,800 | $134,000 | $425,800 |
| 2024 | $4,453 | $535,400 | $125,000 | $410,400 |
| 2023 | $4,310 | $487,900 | $110,000 | $377,900 |
| 2022 | $3,787 | $376,400 | $90,000 | $286,400 |
| 2021 | $3,284 | $284,300 | $80,000 | $204,300 |
| 2020 | $2,931 | $284,300 | $80,000 | $204,300 |
| 2019 | $2,369 | $251,900 | $75,000 | $176,900 |
| 2018 | $2,559 | $239,200 | $70,000 | $169,200 |
| 2017 | $1,932 | $223,800 | $70,000 | $153,800 |
| 2015 | $2,160 | $223,800 | $70,000 | $153,800 |
| 2013 | -- | $220,000 | $70,000 | $150,000 |
Seller's Agent in 2025
Jackson Vanderpool
Windermere CRG
(360) 600-6997
34 Total Sales