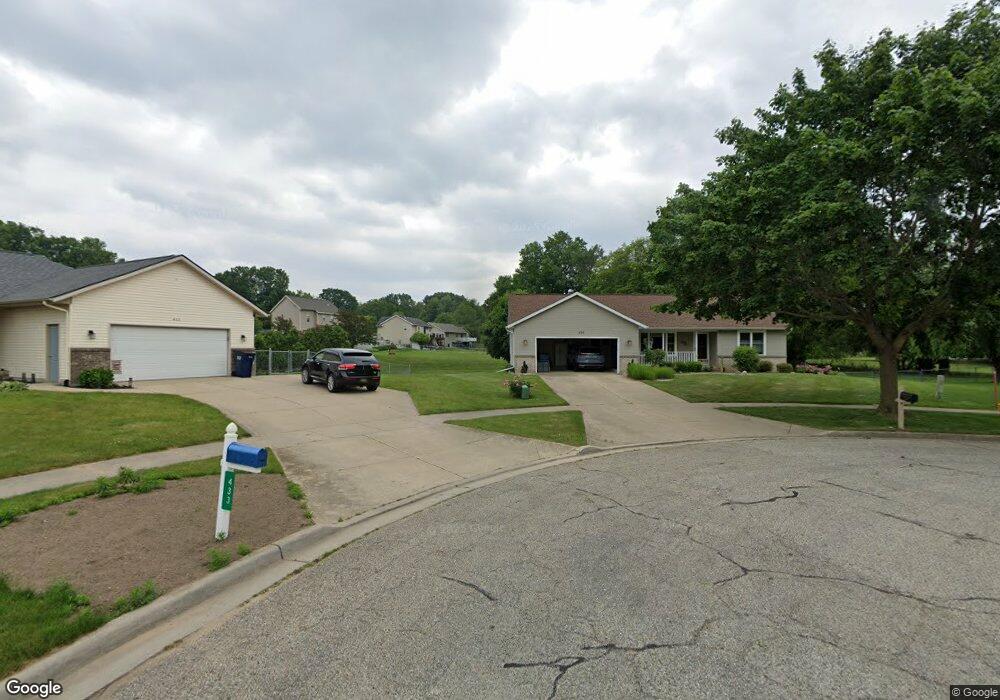
438 Peach Ct Wayland, MI 49348
Estimated Value: $317,939 - $360,000
3
Beds
2
Baths
1,344
Sq Ft
$251/Sq Ft
Est. Value
About This Home
This home is located at 438 Peach Ct, Wayland, MI 49348 and is currently estimated at $336,735, approximately $250 per square foot. 438 Peach Ct is a home located in Allegan County with nearby schools including Wayland High School and St. Therese Catholic School.
Ownership History
Date
Name
Owned For
Owner Type
Purchase Details
Closed on
Apr 18, 2012
Sold by
Williams James M and Williams Sheryl
Bought by
Williams James M and Williams Sheryl L
Current Estimated Value
Purchase Details
Closed on
May 12, 1999
Bought by
Williams James and Williams Sheryl
Purchase Details
Closed on
May 18, 1998
Bought by
Refined Builders Inc
Create a Home Valuation Report for This Property
The Home Valuation Report is an in-depth analysis detailing your home's value as well as a comparison with similar homes in the area
Home Values in the Area
Average Home Value in this Area
Purchase History
| Date | Buyer | Sale Price | Title Company |
|---|---|---|---|
| Williams James M | -- | None Available | |
| Williams James | $139,900 | -- | |
| Refined Builders Inc | $28,900 | -- |
Source: Public Records
Tax History Compared to Growth
Tax History
| Year | Tax Paid | Tax Assessment Tax Assessment Total Assessment is a certain percentage of the fair market value that is determined by local assessors to be the total taxable value of land and additions on the property. | Land | Improvement |
|---|---|---|---|---|
| 2025 | $3,305 | $137,200 | $18,800 | $118,400 |
| 2024 | $3,002 | $121,400 | $15,000 | $106,400 |
| 2023 | $3,002 | $127,000 | $16,300 | $110,700 |
| 2022 | $3,002 | $112,500 | $15,000 | $97,500 |
| 2021 | $2,814 | $103,000 | $14,500 | $88,500 |
| 2020 | $2,814 | $99,900 | $14,500 | $85,400 |
| 2019 | $0 | $88,700 | $13,000 | $75,700 |
| 2018 | $0 | $82,500 | $13,000 | $69,500 |
| 2017 | $0 | $80,600 | $13,000 | $67,600 |
| 2016 | $0 | $70,600 | $13,000 | $57,600 |
| 2015 | -- | $70,600 | $13,000 | $57,600 |
| 2014 | -- | $59,600 | $13,500 | $46,100 |
| 2013 | -- | $57,300 | $13,500 | $43,800 |
Source: Public Records
Map
Nearby Homes
- 621 S Main St
- 146 Hanlon Ct
- 110 E Sycamore St
- 330 Lotz Ct
- 212 E Superior St
- 835 Wild Flower Ct
- 3282 Stonehill Ct
- 319 Alpine St
- 219 Alpine St
- 3296 Stonehill Ct
- 545 N Main St
- 3610 Garden St
- 1143 Regina Trail
- 3570 Windsor Woods Dr
- 3685 Calkins Ct
- 3770 Division Ave S
- 4674 12th St
- 3214 7th St
- 3897 Division St
- 986 129th Ave