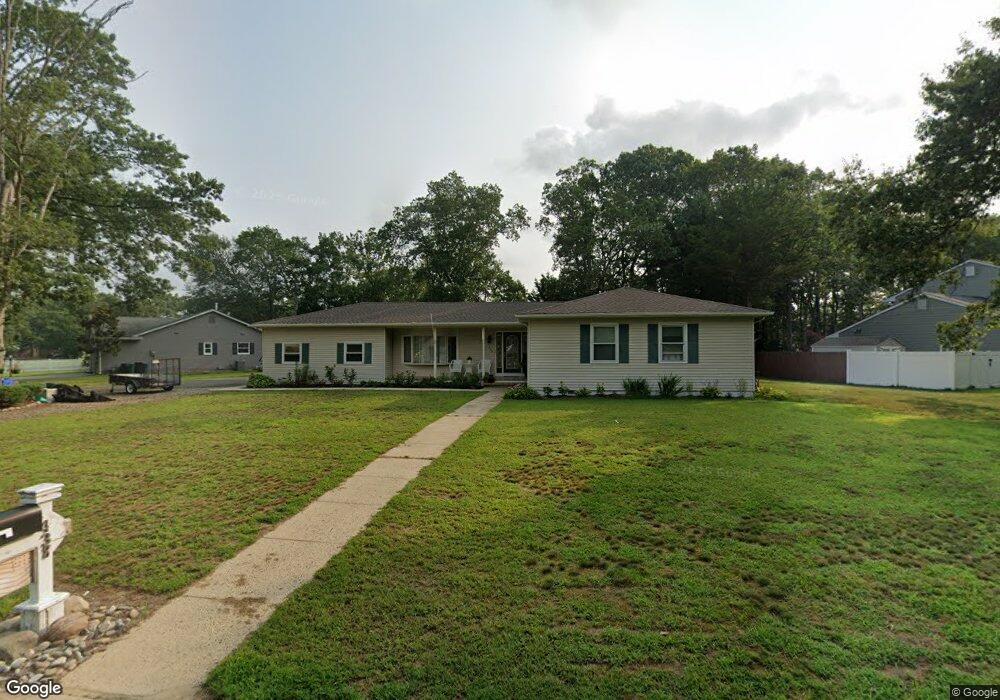
438 Penn Ave N Forked River, NJ 08731
Estimated Value: $492,487 - $575,000
3
Beds
2
Baths
1,520
Sq Ft
$344/Sq Ft
Est. Value
About This Home
This home is located at 438 Penn Ave N, Forked River, NJ 08731 and is currently estimated at $522,872, approximately $343 per square foot. 438 Penn Ave N is a home located in Ocean County with nearby schools including Lacey Township High School.
Ownership History
Date
Name
Owned For
Owner Type
Purchase Details
Closed on
Apr 16, 2010
Sold by
Secretary Of Housing & Urban Development
Bought by
Pieper Mark J
Current Estimated Value
Purchase Details
Closed on
Nov 23, 2009
Sold by
Kupecz Joseph J and Kupecz Barbara A
Bought by
Secretary Of Housing & Urban Development
Purchase Details
Closed on
Aug 11, 2005
Sold by
Sollitto Catherine C
Bought by
Kupecz Joseph J and Kupecz Barbara A
Home Financials for this Owner
Home Financials are based on the most recent Mortgage that was taken out on this home.
Original Mortgage
$317,588
Interest Rate
5.68%
Mortgage Type
FHA
Purchase Details
Closed on
Sep 4, 2001
Sold by
Morello Susan
Bought by
Sollitto Catherine
Home Financials for this Owner
Home Financials are based on the most recent Mortgage that was taken out on this home.
Original Mortgage
$112,000
Interest Rate
6.99%
Create a Home Valuation Report for This Property
The Home Valuation Report is an in-depth analysis detailing your home's value as well as a comparison with similar homes in the area
Home Values in the Area
Average Home Value in this Area
Purchase History
| Date | Buyer | Sale Price | Title Company |
|---|---|---|---|
| Pieper Mark J | $234,100 | Collegiate Title Corporation | |
| Secretary Of Housing & Urban Development | -- | None Available | |
| Kupecz Joseph J | $355,000 | Lawyers Title Ins | |
| Sollitto Catherine | $212,000 | -- |
Source: Public Records
Mortgage History
| Date | Status | Borrower | Loan Amount |
|---|---|---|---|
| Previous Owner | Kupecz Joseph J | $317,588 | |
| Previous Owner | Sollitto Catherine | $112,000 |
Source: Public Records
Tax History
| Year | Tax Paid | Tax Assessment Tax Assessment Total Assessment is a certain percentage of the fair market value that is determined by local assessors to be the total taxable value of land and additions on the property. | Land | Improvement |
|---|---|---|---|---|
| 2025 | $6,490 | $237,300 | $107,500 | $129,800 |
| 2024 | $5,622 | $237,300 | $107,500 | $129,800 |
| 2023 | $5,370 | $237,300 | $107,500 | $129,800 |
| 2022 | $5,370 | $237,300 | $107,500 | $129,800 |
| 2021 | $5,280 | $237,300 | $107,500 | $129,800 |
| 2020 | $5,111 | $237,300 | $107,500 | $129,800 |
| 2019 | $5,021 | $237,300 | $107,500 | $129,800 |
| 2018 | $4,962 | $237,300 | $107,500 | $129,800 |
| 2017 | $4,848 | $237,300 | $107,500 | $129,800 |
| 2016 | $4,829 | $237,300 | $107,500 | $129,800 |
| 2015 | $4,613 | $237,300 | $107,500 | $129,800 |
| 2014 | $4,694 | $272,900 | $137,500 | $135,400 |
Source: Public Records
Map
Nearby Homes
Your Personal Tour Guide
Ask me questions while you tour the home.