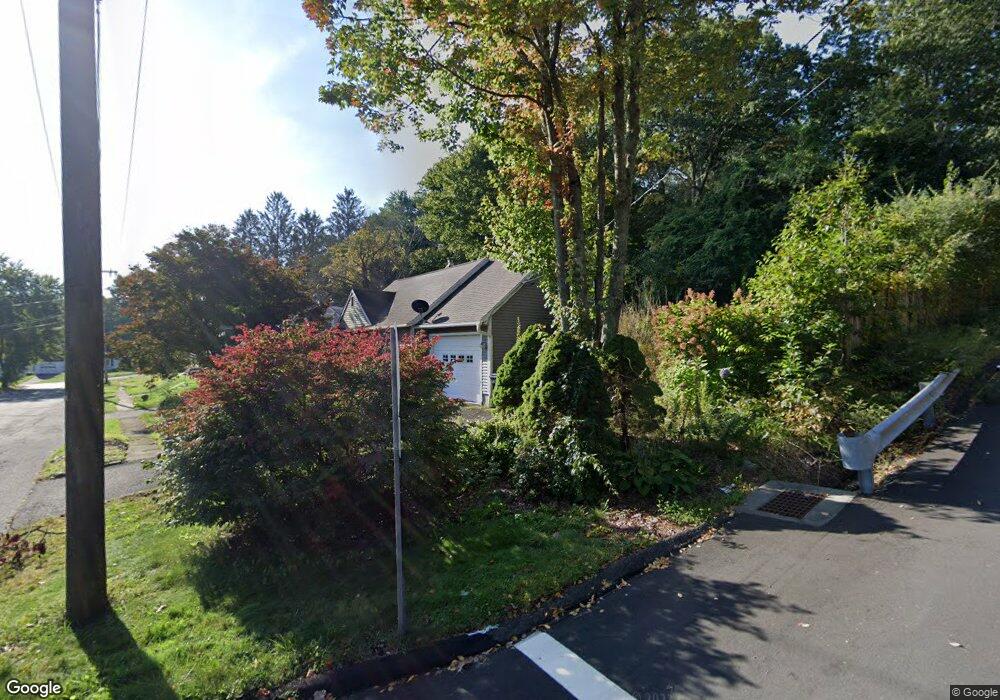
438 Quinn St Naugatuck, CT 06770
Estimated Value: $311,000 - $341,317
3
Beds
1
Bath
1,326
Sq Ft
$248/Sq Ft
Est. Value
About This Home
This home is located at 438 Quinn St, Naugatuck, CT 06770 and is currently estimated at $329,329, approximately $248 per square foot. 438 Quinn St is a home located in New Haven County with nearby schools including City Hill Middle School and Naugatuck High School.
Ownership History
Date
Name
Owned For
Owner Type
Purchase Details
Closed on
Jul 31, 2007
Sold by
Saddig Jeffrey S and Saddig Lisa A
Bought by
Kinley Lonnie James and Kinley Patricia May
Current Estimated Value
Home Financials for this Owner
Home Financials are based on the most recent Mortgage that was taken out on this home.
Original Mortgage
$141,500
Interest Rate
6.78%
Mortgage Type
Purchase Money Mortgage
Purchase Details
Closed on
Sep 23, 2002
Sold by
Peloquin Paul A
Bought by
Saddig Jeffrey S and Saddig Lisa A
Home Financials for this Owner
Home Financials are based on the most recent Mortgage that was taken out on this home.
Original Mortgage
$153,000
Interest Rate
6.36%
Mortgage Type
Purchase Money Mortgage
Purchase Details
Closed on
Aug 24, 1989
Sold by
Bruneau Lori
Bought by
Peloquin Paul
Create a Home Valuation Report for This Property
The Home Valuation Report is an in-depth analysis detailing your home's value as well as a comparison with similar homes in the area
Home Values in the Area
Average Home Value in this Area
Purchase History
| Date | Buyer | Sale Price | Title Company |
|---|---|---|---|
| Kinley Lonnie James | $221,500 | -- | |
| Saddig Jeffrey S | $170,000 | -- | |
| Peloquin Paul | $133,000 | -- |
Source: Public Records
Mortgage History
| Date | Status | Borrower | Loan Amount |
|---|---|---|---|
| Open | Peloquin Paul | $132,500 | |
| Closed | Peloquin Paul | $141,500 | |
| Previous Owner | Peloquin Paul | $175,000 | |
| Previous Owner | Peloquin Paul | $153,000 |
Source: Public Records
Tax History Compared to Growth
Tax History
| Year | Tax Paid | Tax Assessment Tax Assessment Total Assessment is a certain percentage of the fair market value that is determined by local assessors to be the total taxable value of land and additions on the property. | Land | Improvement |
|---|---|---|---|---|
| 2025 | $5,390 | $135,450 | $32,060 | $103,390 |
| 2024 | $5,660 | $135,450 | $32,060 | $103,390 |
| 2023 | $6,061 | $135,450 | $32,060 | $103,390 |
| 2022 | $4,298 | $90,020 | $34,060 | $55,960 |
| 2021 | $4,298 | $90,020 | $34,060 | $55,960 |
| 2020 | $4,298 | $90,020 | $34,060 | $55,960 |
| 2019 | $4,253 | $90,020 | $34,060 | $55,960 |
| 2018 | $4,401 | $91,020 | $43,550 | $47,470 |
| 2017 | $4,419 | $91,020 | $43,550 | $47,470 |
| 2016 | $4,339 | $91,020 | $43,550 | $47,470 |
| 2015 | $4,148 | $91,020 | $43,550 | $47,470 |
| 2014 | $4,101 | $91,020 | $43,550 | $47,470 |
| 2012 | $4,589 | $136,770 | $51,960 | $84,810 |
Source: Public Records
Map
Nearby Homes
- 49 Damson Ln
- 96 Round Hill Rd
- 92 Birch Ln
- 31 Pilgrim Ln
- 151 Timothy Rd
- 65 Round Tree Dr Unit 5
- 48 Round Tree Dr Unit 5
- 40 Ridge Rd Unit 3
- 75 Allerton Rd
- 146 Coach Cir Unit 5
- 53 Mill St
- 19 Casper Ct
- 101 Ridge Rd Unit 5
- 0 Silver Ridge Ln Unit 24139632
- 2 Silver Ridge Ln
- 66 N Hoadley St
- 0 Field St Unit 170385250
- 627 Millville Ave Unit 9-8
- 739 Field St
- 24 New St