Estimated Value: $382,000 - $488,000
4
Beds
2
Baths
2,038
Sq Ft
$203/Sq Ft
Est. Value
About This Home
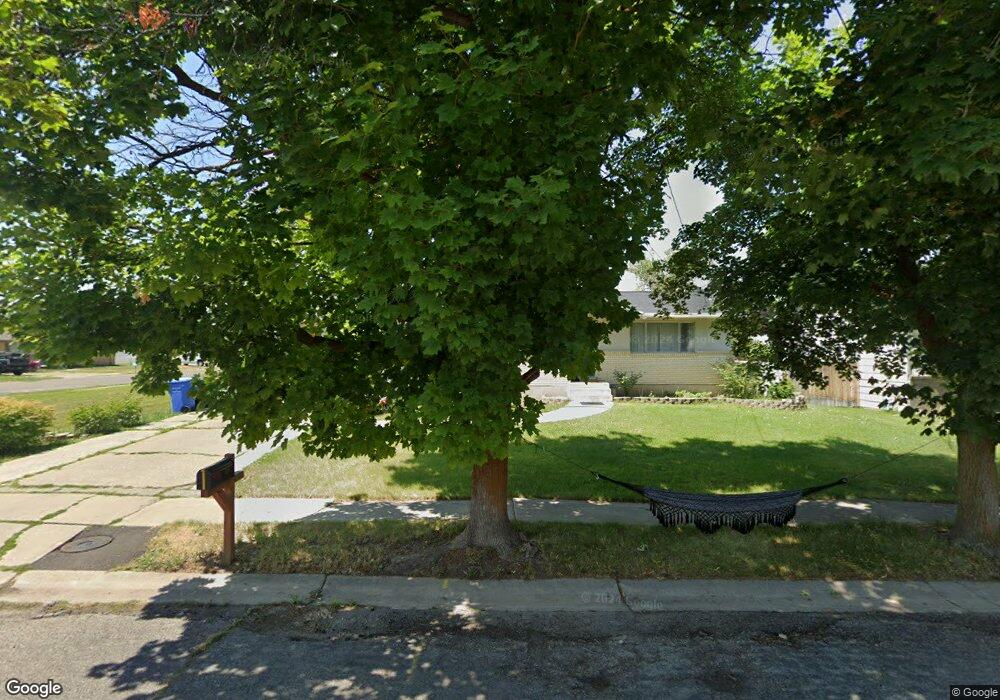
This home is located at 438 S 600 E, Hyrum, UT 84319 and is currently estimated at $414,288, approximately $203 per square foot. 438 S 600 E is a home located in Cache County with nearby schools including Millville School, South Cache Middle School, and Mountain Crest High School.
Ownership History
Date
Name
Owned For
Owner Type
Purchase Details
Closed on
Oct 23, 2019
Sold by
Atkinson Andrew Lamar and Atkinson Marilyn
Bought by
Rollins Dennis G
Current Estimated Value
Home Financials for this Owner
Home Financials are based on the most recent Mortgage that was taken out on this home.
Original Mortgage
$246,464
Outstanding Balance
$215,438
Interest Rate
3.5%
Mortgage Type
New Conventional
Estimated Equity
$198,850
Purchase Details
Closed on
Apr 11, 2019
Sold by
Atkinson Andrew Lamar
Bought by
Atkinson Andrew Lamar and Atkinson Marilyn T
Home Financials for this Owner
Home Financials are based on the most recent Mortgage that was taken out on this home.
Original Mortgage
$95,200
Interest Rate
4.3%
Mortgage Type
Credit Line Revolving
Purchase Details
Closed on
Nov 10, 2006
Sold by
Bloxham Douglas Robert
Bought by
Bloxham Marilyn
Create a Home Valuation Report for This Property
The Home Valuation Report is an in-depth analysis detailing your home's value as well as a comparison with similar homes in the area
Home Values in the Area
Average Home Value in this Area
Purchase History
| Date | Buyer | Sale Price | Title Company |
|---|---|---|---|
| Rollins Dennis G | -- | Investors Title Agency Inc | |
| Atkinson Andrew Lamar | -- | American Secure Title Logan | |
| Atkinson Andrew Lamar | -- | American Scrure Title Logan | |
| Bloxham Marilyn | -- | None Available |
Source: Public Records
Mortgage History
| Date | Status | Borrower | Loan Amount |
|---|---|---|---|
| Open | Rollins Dennis G | $246,464 | |
| Previous Owner | Atkinson Andrew Lamar | $95,200 |
Source: Public Records
Tax History
| Year | Tax Paid | Tax Assessment Tax Assessment Total Assessment is a certain percentage of the fair market value that is determined by local assessors to be the total taxable value of land and additions on the property. | Land | Improvement |
|---|---|---|---|---|
| 2025 | $1,362 | $195,615 | $0 | $0 |
| 2024 | $1,460 | $195,810 | $0 | $0 |
| 2023 | $1,516 | $194,340 | $0 | $0 |
| 2022 | $1,582 | $194,340 | $0 | $0 |
| 2021 | $1,515 | $286,810 | $65,050 | $221,760 |
| 2020 | $1,407 | $249,850 | $65,050 | $184,800 |
| 2019 | $1,024 | $171,045 | $41,000 | $130,045 |
| 2018 | $936 | $151,208 | $41,000 | $110,208 |
| 2017 | $915 | $76,670 | $0 | $0 |
| 2016 | $935 | $76,670 | $0 | $0 |
| 2015 | $938 | $76,670 | $0 | $0 |
| 2014 | $899 | $75,190 | $0 | $0 |
| 2013 | -- | $75,190 | $0 | $0 |
Source: Public Records
Map
Nearby Homes
Your Personal Tour Guide
Ask me questions while you tour the home.