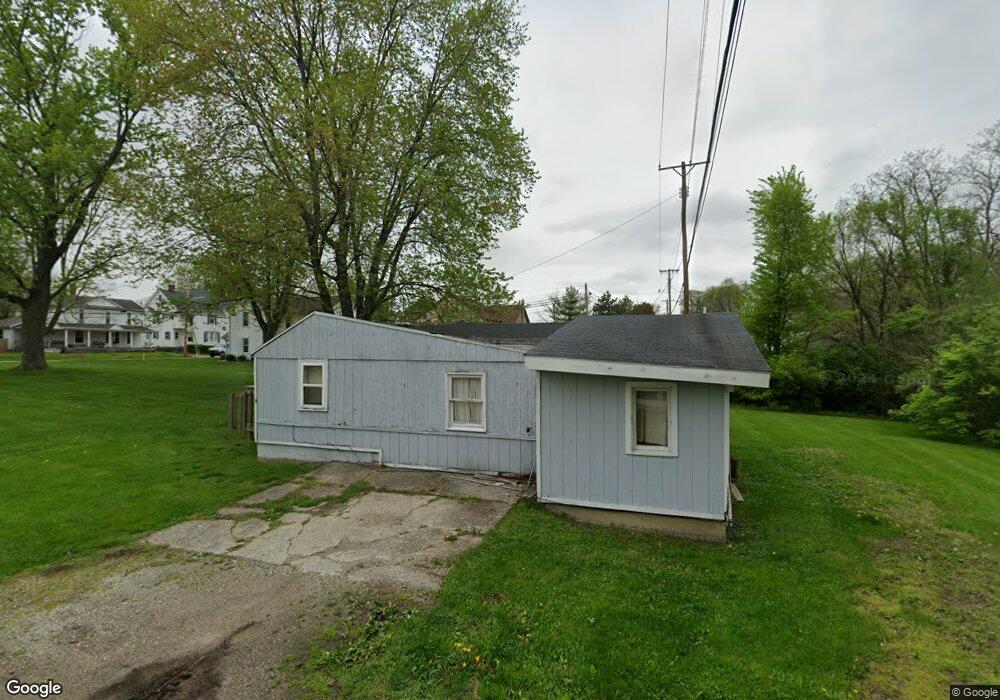
438 S Miami St West Milton, OH 45383
Estimated Value: $79,428
1
Bed
1
Bath
624
Sq Ft
$127/Sq Ft
Est. Value
About This Home
This home is located at 438 S Miami St, West Milton, OH 45383 and is currently estimated at $79,428, approximately $127 per square foot. 438 S Miami St is a home located in Miami County with nearby schools including Milton-Union Elementary School, Milton-Union Middle School, and Milton-Union High School.
Ownership History
Date
Name
Owned For
Owner Type
Purchase Details
Closed on
Oct 27, 2022
Sold by
James And Denise Lanning Trust
Bought by
Municipality Of West Milton
Current Estimated Value
Purchase Details
Closed on
Apr 4, 2022
Sold by
Ward Larry F
Bought by
James And Denise Lanning Trust
Purchase Details
Closed on
Apr 22, 2005
Sold by
Mcknight Della and Ditmer Della
Bought by
Ward Larry F
Purchase Details
Closed on
Jan 1, 1990
Bought by
Mcknight Della
Create a Home Valuation Report for This Property
The Home Valuation Report is an in-depth analysis detailing your home's value as well as a comparison with similar homes in the area
Home Values in the Area
Average Home Value in this Area
Purchase History
| Date | Buyer | Sale Price | Title Company |
|---|---|---|---|
| Municipality Of West Milton | -- | None Listed On Document | |
| James And Denise Lanning Trust | -- | Fullenkamp James J | |
| Ward Larry F | $45,000 | -- | |
| Mcknight Della | -- | -- |
Source: Public Records
Tax History Compared to Growth
Tax History
| Year | Tax Paid | Tax Assessment Tax Assessment Total Assessment is a certain percentage of the fair market value that is determined by local assessors to be the total taxable value of land and additions on the property. | Land | Improvement |
|---|---|---|---|---|
| 2024 | -- | $0 | $0 | $0 |
| 2023 | $495 | $13,130 | $13,130 | $0 |
| 2022 | $592 | $15,200 | $13,130 | $2,070 |
| 2021 | $619 | $13,790 | $10,500 | $3,290 |
| 2020 | $621 | $13,790 | $10,500 | $3,290 |
| 2019 | $624 | $13,790 | $10,500 | $3,290 |
| 2018 | $642 | $13,240 | $10,400 | $2,840 |
| 2017 | $642 | $13,240 | $10,400 | $2,840 |
| 2016 | $616 | $13,240 | $10,400 | $2,840 |
| 2015 | $695 | $14,740 | $10,010 | $4,730 |
| 2014 | $695 | $14,740 | $10,010 | $4,730 |
| 2013 | $942 | $20,720 | $10,010 | $10,710 |
Source: Public Records
Map
Nearby Homes