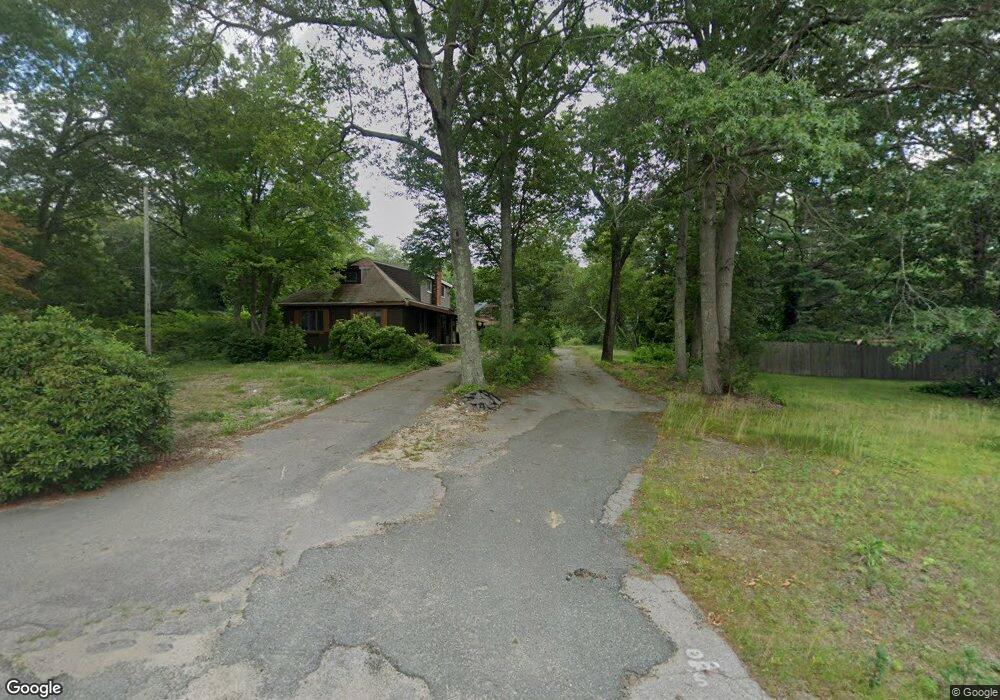
438 South St Foxboro, MA 02035
Estimated Value: $515,000 - $661,803
3
Beds
3
Baths
1,887
Sq Ft
$319/Sq Ft
Est. Value
About This Home
This home is located at 438 South St, Foxboro, MA 02035 and is currently estimated at $601,201, approximately $318 per square foot. 438 South St is a home located in Norfolk County with nearby schools including Foxborough High School, Foxborough Regional Charter School, and Hands-On-Montessori School.
Ownership History
Date
Name
Owned For
Owner Type
Purchase Details
Closed on
Feb 3, 2017
Sold by
Moreshead Elizabeth L
Bought by
Peterson Daniel C
Current Estimated Value
Home Financials for this Owner
Home Financials are based on the most recent Mortgage that was taken out on this home.
Original Mortgage
$270,000
Outstanding Balance
$224,172
Interest Rate
4.3%
Mortgage Type
New Conventional
Estimated Equity
$377,029
Purchase Details
Closed on
Mar 3, 1972
Bought by
Moreshead Elizabeth
Create a Home Valuation Report for This Property
The Home Valuation Report is an in-depth analysis detailing your home's value as well as a comparison with similar homes in the area
Home Values in the Area
Average Home Value in this Area
Purchase History
| Date | Buyer | Sale Price | Title Company |
|---|---|---|---|
| Peterson Daniel C | $300,000 | -- | |
| Moreshead Elizabeth | -- | -- |
Source: Public Records
Mortgage History
| Date | Status | Borrower | Loan Amount |
|---|---|---|---|
| Open | Peterson Daniel C | $270,000 | |
| Previous Owner | Moreshead Elizabeth | $150,000 |
Source: Public Records
Tax History Compared to Growth
Tax History
| Year | Tax Paid | Tax Assessment Tax Assessment Total Assessment is a certain percentage of the fair market value that is determined by local assessors to be the total taxable value of land and additions on the property. | Land | Improvement |
|---|---|---|---|---|
| 2025 | $6,562 | $496,400 | $237,500 | $258,900 |
| 2024 | $6,585 | $487,400 | $255,600 | $231,800 |
| 2023 | $6,500 | $457,400 | $243,600 | $213,800 |
| 2022 | $6,233 | $429,300 | $218,700 | $210,600 |
| 2021 | $6,002 | $407,200 | $207,800 | $199,400 |
| 2020 | $5,933 | $407,200 | $207,800 | $199,400 |
| 2019 | $6,694 | $455,400 | $263,900 | $191,500 |
| 2018 | $6,210 | $426,200 | $253,600 | $172,600 |
| 2017 | $5,091 | $338,500 | $194,700 | $143,800 |
| 2016 | $4,956 | $334,400 | $187,600 | $146,800 |
| 2015 | $4,490 | $295,600 | $140,100 | $155,500 |
| 2014 | $4,431 | $295,600 | $140,100 | $155,500 |
Source: Public Records
Map
Nearby Homes