Estimated Value: $191,000 - $233,000
2
Beds
2
Baths
1,009
Sq Ft
$209/Sq Ft
Est. Value
About This Home
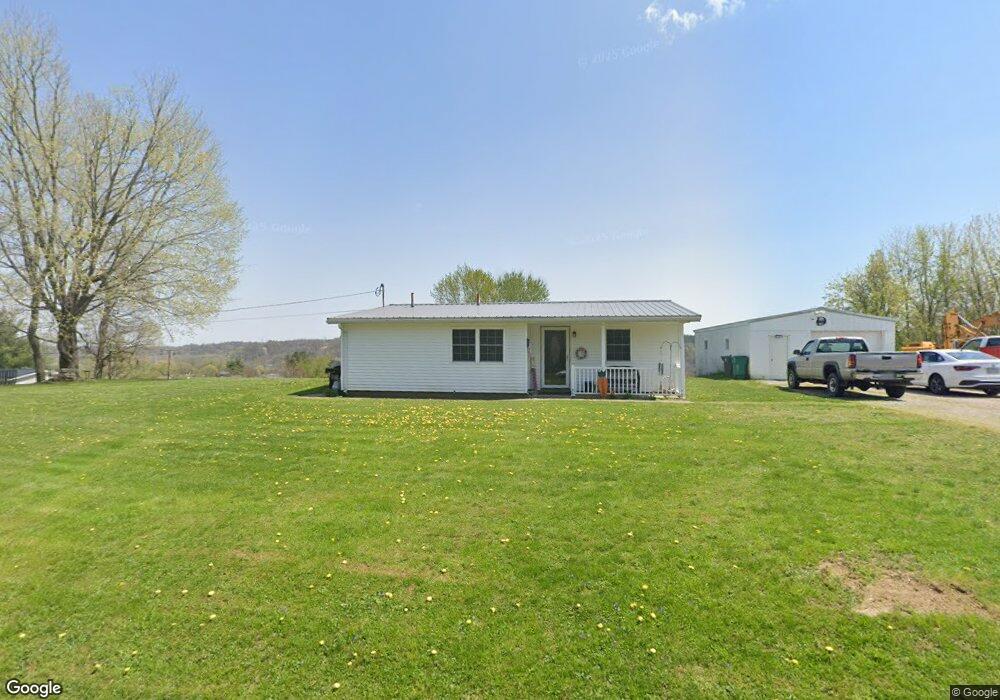
This home is located at 438 Spring St, Philo, OH 43771 and is currently estimated at $211,071, approximately $209 per square foot. 438 Spring St is a home located in Muskingum County with nearby schools including Philo High School.
Ownership History
Date
Name
Owned For
Owner Type
Purchase Details
Closed on
Jul 18, 2022
Sold by
Dickson Allen R and Dickson Anita J
Bought by
Dickson Alan R and Dickson Anita J
Current Estimated Value
Create a Home Valuation Report for This Property
The Home Valuation Report is an in-depth analysis detailing your home's value as well as a comparison with similar homes in the area
Purchase History
| Date | Buyer | Sale Price | Title Company |
|---|---|---|---|
| Dickson Alan R | -- | Rankin D Scott | |
| Dickson Alan R | -- | Rankin D Scott |
Source: Public Records
Tax History
| Year | Tax Paid | Tax Assessment Tax Assessment Total Assessment is a certain percentage of the fair market value that is determined by local assessors to be the total taxable value of land and additions on the property. | Land | Improvement |
|---|---|---|---|---|
| 2025 | $2,126 | $30,870 | $3,640 | $27,230 |
| 2024 | $1,107 | $30,870 | $3,640 | $27,230 |
| 2023 | $1,059 | $27,090 | $2,660 | $24,430 |
| 2022 | $1,037 | $27,090 | $2,660 | $24,430 |
| 2021 | $1,023 | $27,090 | $2,660 | $24,430 |
| 2020 | $888 | $22,540 | $2,205 | $20,335 |
| 2019 | $886 | $22,540 | $2,205 | $20,335 |
| 2018 | $827 | $22,540 | $2,205 | $20,335 |
| 2017 | $766 | $17,395 | $2,205 | $15,190 |
| 2016 | $741 | $16,980 | $2,210 | $14,770 |
| 2015 | $752 | $16,980 | $2,210 | $14,770 |
| 2013 | $717 | $16,980 | $2,210 | $14,770 |
Source: Public Records
Map
Nearby Homes
- 307 Harris St
- 960 3rd St
- 252 Front St
- 134 Main St
- 385 Water St
- 243 Mill St
- 512 North St
- 4145 Old River Rd
- 0 Sealover Hollow Rd
- 0 Durant Rd Unit 5186947
- 3100 Durant Rd
- 1685 Fattler Ridge Rd
- 3345 Durant Rd
- 8285 Old River Rd
- 965 Back Run Rd
- 2630 Wilhelm Rd
- 8950 Gaysport Hill Rd
- 9120 Shady Ln
- 3900 Chandlersville Rd
- 3010 S River Rd
Your Personal Tour Guide
Ask me questions while you tour the home.