Estimated Value: $164,000 - $339,000
--
Bed
2
Baths
1,809
Sq Ft
$129/Sq Ft
Est. Value
About This Home
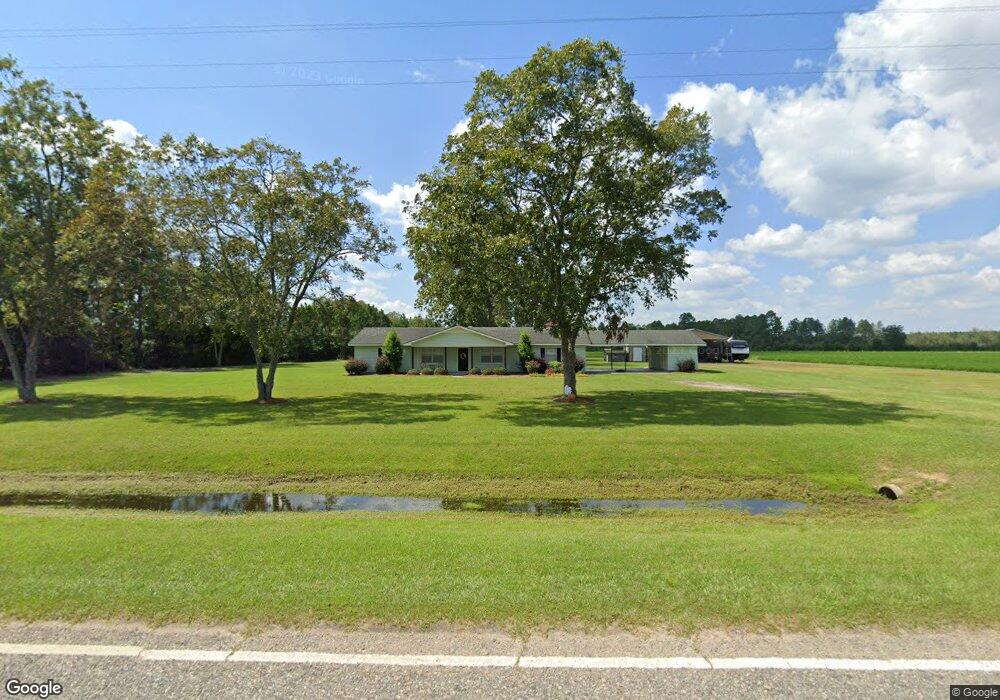
This home is located at 438 Teakwood Rd, Alma, GA 31510 and is currently estimated at $232,565, approximately $128 per square foot. 438 Teakwood Rd is a home located in Bacon County with nearby schools including Bacon County Primary School, Bacon County Elementary School, and Bacon County Middle School.
Ownership History
Date
Name
Owned For
Owner Type
Purchase Details
Closed on
Feb 12, 2018
Sold by
Dhl Farms Inc
Bought by
Lee Tyler John W and Lee Tyler Kimberly
Current Estimated Value
Home Financials for this Owner
Home Financials are based on the most recent Mortgage that was taken out on this home.
Original Mortgage
$95,700
Outstanding Balance
$81,049
Interest Rate
3.99%
Mortgage Type
New Conventional
Estimated Equity
$151,516
Purchase Details
Closed on
Mar 12, 2015
Sold by
Mullis Steve
Bought by
Dhl Farms Inc
Purchase Details
Closed on
Jan 16, 2015
Sold by
Mullis Christopher Steven
Bought by
Mullis Steve
Purchase Details
Closed on
Feb 20, 2014
Sold by
Mullis Larry Zeak
Bought by
Mullis Christopher Steven
Purchase Details
Closed on
Apr 5, 2013
Sold by
Cole Joyce Barnes
Bought by
Mullis Larry Zeak
Create a Home Valuation Report for This Property
The Home Valuation Report is an in-depth analysis detailing your home's value as well as a comparison with similar homes in the area
Home Values in the Area
Average Home Value in this Area
Purchase History
| Date | Buyer | Sale Price | Title Company |
|---|---|---|---|
| Lee Tyler John W | $120,000 | -- | |
| Dhl Farms Inc | $80,000 | -- | |
| Mullis Steve | -- | -- | |
| Mullis Christopher Steven | -- | -- | |
| Mullis Larry Zeak | $65,000 | -- |
Source: Public Records
Mortgage History
| Date | Status | Borrower | Loan Amount |
|---|---|---|---|
| Open | Lee Tyler John W | $95,700 |
Source: Public Records
Tax History Compared to Growth
Tax History
| Year | Tax Paid | Tax Assessment Tax Assessment Total Assessment is a certain percentage of the fair market value that is determined by local assessors to be the total taxable value of land and additions on the property. | Land | Improvement |
|---|---|---|---|---|
| 2024 | $1,454 | $75,276 | $25,680 | $49,596 |
| 2023 | $1,400 | $71,116 | $25,680 | $45,436 |
| 2022 | $997 | $56,516 | $25,680 | $30,836 |
| 2021 | $910 | $53,476 | $25,680 | $27,796 |
| 2020 | $877 | $48,960 | $23,724 | $25,236 |
| 2019 | $874 | $48,960 | $23,724 | $25,236 |
| 2018 | $849 | $48,030 | $23,724 | $24,306 |
| 2017 | $1,173 | $40,840 | $23,724 | $17,116 |
| 2016 | $695 | $40,840 | $23,724 | $17,116 |
| 2015 | $679 | $40,350 | $23,724 | $16,626 |
| 2014 | $850 | $40,465 | $23,724 | $16,742 |
| 2013 | $850 | $29,518 | $13,050 | $16,468 |
Source: Public Records
Map
Nearby Homes
- 596 Teakwood Rd
- 126 Spruce Dr
- 2148 Georgia 32
- 1813 W 12th St
- 2193 Georgia 32
- 198 Meadow Rd
- 166 Grace Loop Unit 1
- 113 Brite Blue Dr
- 1608 W 4th St
- 1505 W 4th Street Extension
- 220 Lakeshore Dr
- 220 Lake Shore Dr
- 159 Jabbers Ln
- 118 Morris Dr
- 1109 W 4th Street Extension
- 0 Lake Lure Dr
- 314 W 16th St
- 117 Grace Loop Unit 1
- 118 Grace Loop Unit 1
- 122 Grace Loop Unit 1
- 000 Teakwood Rd
- 390 Teakwood Rd
- 387 Teakwood Rd
- 533 Pineview Rd
- 525 Teakwood Rd
- 280 Spruce Dr
- 278 Spruce Dr
- 263 Spruce Dr
- 274 Spruce Dr
- 108 Daughtry Dr
- 264 Spruce Dr
- 560 Teakwood Rd
- 120 Woodland Ln
- 435 Pineview Rd
- 433 Pineview Rd
- 279 Pineview Rd
- 0 Pineview Rd Unit 112662
- 0 Pineview Rd
- 312 Pineview Rd
- 243 Cypress Cir