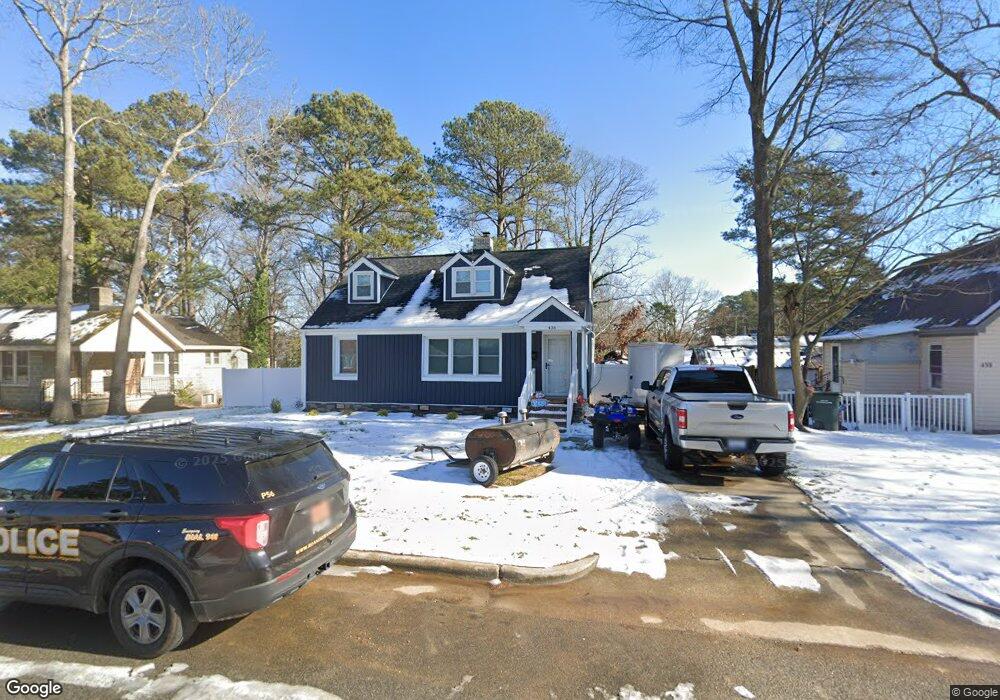
438 W 5th St Roanoke Rapids, NC 27870
Estimated Value: $64,000 - $107,000
4
Beds
1
Bath
1,176
Sq Ft
$72/Sq Ft
Est. Value
About This Home
This home is located at 438 W 5th St, Roanoke Rapids, NC 27870 and is currently estimated at $84,931, approximately $72 per square foot. 438 W 5th St is a home located in Halifax County with nearby schools including Roanoke Rapids High School and Victory Christian Academy.
Ownership History
Date
Name
Owned For
Owner Type
Purchase Details
Closed on
Nov 18, 2021
Sold by
Spragins Joshua Allen and Spragins Katie Smith
Bought by
Jas Rantalas Llc
Current Estimated Value
Home Financials for this Owner
Home Financials are based on the most recent Mortgage that was taken out on this home.
Original Mortgage
$37,500
Outstanding Balance
$34,362
Interest Rate
2.99%
Mortgage Type
Closed End Mortgage
Estimated Equity
$50,569
Purchase Details
Closed on
Feb 19, 2021
Sold by
Spragins Joshua Allen
Bought by
Jas Rentals Llc
Purchase Details
Closed on
Feb 17, 2020
Sold by
Garner Elmo T and Garner Jane B
Bought by
Spragins Joshua A
Create a Home Valuation Report for This Property
The Home Valuation Report is an in-depth analysis detailing your home's value as well as a comparison with similar homes in the area
Purchase History
| Date | Buyer | Sale Price | Title Company |
|---|---|---|---|
| Jas Rantalas Llc | -- | None Available | |
| Jas Rentals Llc | -- | None Available | |
| Spragins Joshua A | $39,000 | None Available |
Source: Public Records
Mortgage History
| Date | Status | Borrower | Loan Amount |
|---|---|---|---|
| Open | Jas Rantalas Llc | $37,500 |
Source: Public Records
Tax History
| Year | Tax Paid | Tax Assessment Tax Assessment Total Assessment is a certain percentage of the fair market value that is determined by local assessors to be the total taxable value of land and additions on the property. | Land | Improvement |
|---|---|---|---|---|
| 2025 | $13 | $62,200 | $20,400 | $41,800 |
| 2024 | $13 | $62,200 | $20,400 | $41,800 |
| 2023 | $1,220 | $55,500 | $20,400 | $35,100 |
| 2022 | $1,221 | $55,500 | $20,400 | $35,100 |
| 2021 | $1,171 | $55,500 | $20,400 | $35,100 |
| 2020 | $1,165 | $55,500 | $20,400 | $35,100 |
| 2019 | $1,003 | $41,000 | $13,000 | $28,000 |
| 2018 | $999 | $45,000 | $13,000 | $32,000 |
| 2017 | $970 | $45,000 | $13,000 | $32,000 |
| 2016 | $1,009 | $45,000 | $13,000 | $32,000 |
| 2015 | $965 | $45,000 | $13,000 | $32,000 |
| 2014 | $970 | $47,830 | $15,200 | $32,630 |
Source: Public Records
Map
Nearby Homes
- 340 Rapids St
- 638 Rapids St
- 700 Vance St
- 602 Cleveland St
- 700 Henry St
- 808 Monroe St
- 525 Hamilton St
- 906 Rapids St
- 1316 Bolling Rd
- 321 Shell Dr
- 112 E 7th St
- 909 Monroe St
- 2124 N Carolina 48
- 537 Jefferson St
- 515 Oakwood Ave
- 2077, 91 W 10th St
- 638 A B Jefferson St
- 1203 W 10th St
- 106 Washington St
- 65 Washington St
Your Personal Tour Guide
Ask me questions while you tour the home.