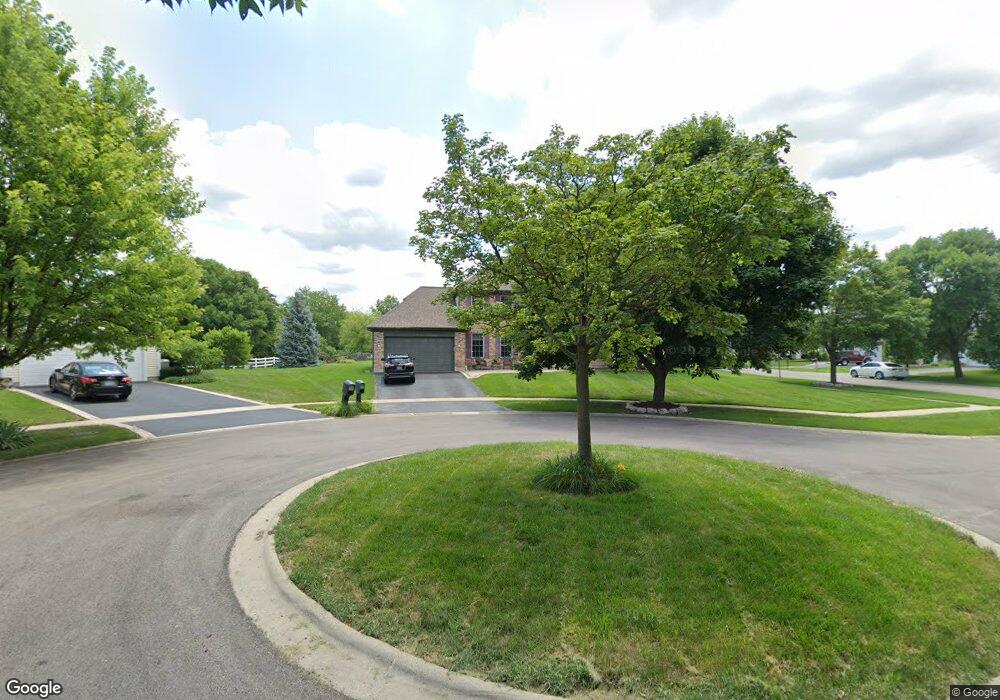
438 W Trail Ct Unit W Grayslake, IL 60030
Estimated Value: $464,000 - $493,000
4
Beds
3
Baths
2,534
Sq Ft
$191/Sq Ft
Est. Value
About This Home
This home is located at 438 W Trail Ct Unit W, Grayslake, IL 60030 and is currently estimated at $484,383, approximately $191 per square foot. 438 W Trail Ct Unit W is a home located in Lake County with nearby schools including Woodview School, Frederick School, and Grayslake Middle School.
Ownership History
Date
Name
Owned For
Owner Type
Purchase Details
Closed on
Apr 13, 2018
Sold by
Powers John G and Powers Jennifer M
Bought by
Powers John G and John G Powers Revocable Trsut
Current Estimated Value
Purchase Details
Closed on
Apr 10, 2001
Sold by
Kohout Daniel J and Ferguson Kohout Nicole M
Bought by
Powers John G and Powers Jennifer M
Home Financials for this Owner
Home Financials are based on the most recent Mortgage that was taken out on this home.
Original Mortgage
$227,800
Outstanding Balance
$84,038
Interest Rate
7.03%
Estimated Equity
$400,345
Purchase Details
Closed on
Jul 1, 1998
Sold by
Houser Paul D and Houser Madonna L
Bought by
Kohout Daniel J and Ferguson Kohout Nicole M
Home Financials for this Owner
Home Financials are based on the most recent Mortgage that was taken out on this home.
Original Mortgage
$198,900
Interest Rate
7.15%
Create a Home Valuation Report for This Property
The Home Valuation Report is an in-depth analysis detailing your home's value as well as a comparison with similar homes in the area
Home Values in the Area
Average Home Value in this Area
Purchase History
| Date | Buyer | Sale Price | Title Company |
|---|---|---|---|
| Powers John G | -- | None Available | |
| Powers John G | $268,000 | -- | |
| Kohout Daniel J | $221,000 | -- |
Source: Public Records
Mortgage History
| Date | Status | Borrower | Loan Amount |
|---|---|---|---|
| Open | Powers John G | $227,800 | |
| Previous Owner | Kohout Daniel J | $198,900 |
Source: Public Records
Tax History Compared to Growth
Tax History
| Year | Tax Paid | Tax Assessment Tax Assessment Total Assessment is a certain percentage of the fair market value that is determined by local assessors to be the total taxable value of land and additions on the property. | Land | Improvement |
|---|---|---|---|---|
| 2024 | $12,819 | $133,855 | $26,642 | $107,213 |
| 2023 | $13,031 | $116,999 | $23,287 | $93,712 |
| 2022 | $13,031 | $114,666 | $17,929 | $96,737 |
| 2021 | $12,886 | $110,214 | $17,233 | $92,981 |
| 2020 | $12,891 | $104,866 | $16,397 | $88,469 |
| 2019 | $12,451 | $100,611 | $15,732 | $84,879 |
| 2018 | $7,224 | $108,072 | $23,361 | $84,711 |
| 2017 | $13,283 | $101,657 | $21,974 | $79,683 |
| 2016 | $12,766 | $93,840 | $20,284 | $73,556 |
| 2015 | $12,464 | $85,730 | $18,531 | $67,199 |
| 2014 | $11,983 | $80,212 | $16,948 | $63,264 |
| 2012 | $11,441 | $83,772 | $17,700 | $66,072 |
Source: Public Records
Map
Nearby Homes
- 219 Galway St
- 739 Alleghany Rd
- 21238 W Washington St
- 34386 N Lakeside Dr
- 159 E Elk Ct
- 337 Woodland Dr Unit 6
- 372 White Tail Dr
- 1270 Chesterfield Ln
- 113 E Big Horn Dr
- 872 Tylerton Cir
- 375 N Tower Dr Unit 1202
- 230 N Alleghany Rd
- 71 Pimlico Ct
- 1409 Doolittle Ln
- 65 Pimlico Ct
- 34069 N Hainesville Rd
- 1431 Doolittle Ln
- 223 Litchfield Ct
- 448 N Patriot Dr Unit 705
- 268 Normandy Ln
- 426 West Trail N
- 448 W Trail Ct Unit W
- 416 West Trail N
- 458 W Trail Ct Unit W
- 469 West Trail N
- 483 West Trail N
- 455 West Trail N
- 478 W Trail Ct Unit W
- 468 W Trail Ct Unit W
- 406 West Trail N
- 441 West Trail N
- 497 West Trail N
- 427 West Trail N
- 496 West Trail N
- 413 W Trail Ct
- 413 West Trail N
- 505 West Trail N
- 999 Alleghany Rd
- 502 West Trail N
- 34025 N Gerwal Ave