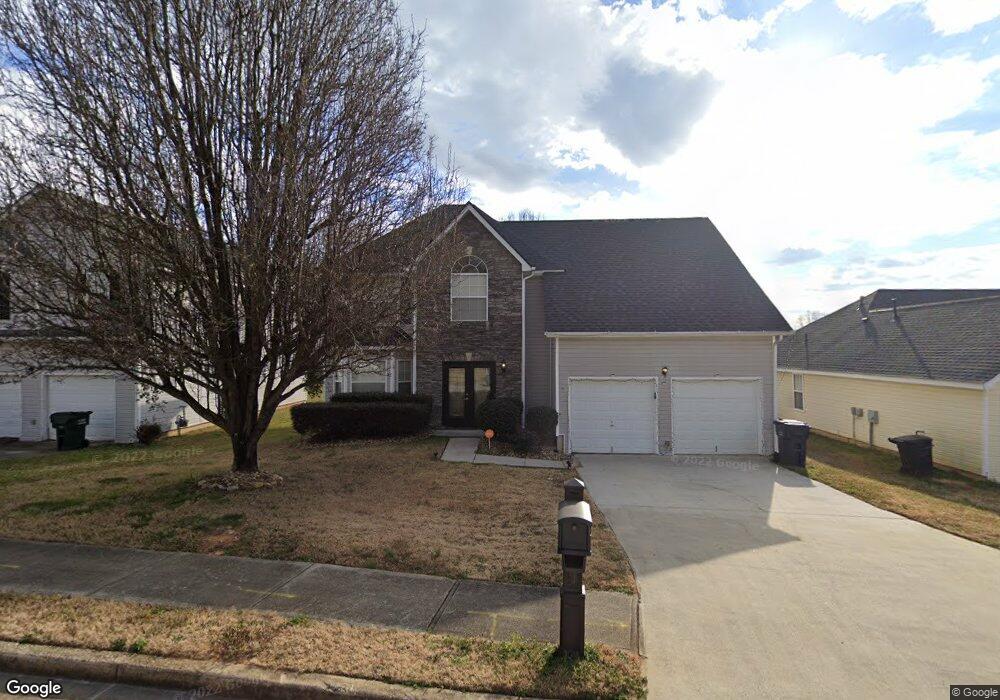
4380 Millenium View Ct SW Snellville, GA 30039
Estimated Value: $344,000 - $370,000
4
Beds
3
Baths
2,140
Sq Ft
$167/Sq Ft
Est. Value
About This Home
This home is located at 4380 Millenium View Ct SW, Snellville, GA 30039 and is currently estimated at $358,227, approximately $167 per square foot. 4380 Millenium View Ct SW is a home located in Gwinnett County with nearby schools including Rosebud Elementary School, Grace Snell Middle School, and South Gwinnett High School.
Ownership History
Date
Name
Owned For
Owner Type
Purchase Details
Closed on
Jun 25, 2021
Sold by
Ribbon Home Spv Ii Llc
Bought by
Bouery Andrew
Current Estimated Value
Home Financials for this Owner
Home Financials are based on the most recent Mortgage that was taken out on this home.
Original Mortgage
$282,348
Outstanding Balance
$255,073
Interest Rate
2.9%
Mortgage Type
VA
Estimated Equity
$103,154
Purchase Details
Closed on
May 13, 2021
Sold by
Myrick Angela
Bought by
Ribbon Home Spv Ii Llc
Home Financials for this Owner
Home Financials are based on the most recent Mortgage that was taken out on this home.
Original Mortgage
$282,348
Outstanding Balance
$255,073
Interest Rate
2.9%
Mortgage Type
VA
Estimated Equity
$103,154
Purchase Details
Closed on
Jan 31, 2002
Sold by
Ellenwood Development Co Inc
Bought by
Myrick Angela
Home Financials for this Owner
Home Financials are based on the most recent Mortgage that was taken out on this home.
Original Mortgage
$142,400
Interest Rate
7.02%
Mortgage Type
FHA
Create a Home Valuation Report for This Property
The Home Valuation Report is an in-depth analysis detailing your home's value as well as a comparison with similar homes in the area
Home Values in the Area
Average Home Value in this Area
Purchase History
| Date | Buyer | Sale Price | Title Company |
|---|---|---|---|
| Bouery Andrew | $276,000 | -- | |
| Bouery Andrew | $276,000 | -- | |
| Ribbon Home Spv Ii Llc | $276,000 | -- | |
| Ribbon Home Spv Ii Llc | $276,000 | -- | |
| Myrick Angela | $144,700 | -- | |
| Myrick Angela | $144,700 | -- |
Source: Public Records
Mortgage History
| Date | Status | Borrower | Loan Amount |
|---|---|---|---|
| Open | Bouery Andrew | $282,348 | |
| Previous Owner | Myrick Angela | $142,400 |
Source: Public Records
Tax History Compared to Growth
Tax History
| Year | Tax Paid | Tax Assessment Tax Assessment Total Assessment is a certain percentage of the fair market value that is determined by local assessors to be the total taxable value of land and additions on the property. | Land | Improvement |
|---|---|---|---|---|
| 2025 | $4,456 | $151,640 | $19,800 | $131,840 |
| 2024 | $4,643 | $152,400 | $19,800 | $132,600 |
| 2023 | $4,643 | $132,920 | $27,080 | $105,840 |
| 2022 | $3,738 | $110,400 | $20,000 | $90,400 |
| 2021 | $2,857 | $90,520 | $16,000 | $74,520 |
| 2020 | $2,689 | $81,800 | $14,000 | $67,800 |
| 2019 | $2,479 | $75,360 | $12,800 | $62,560 |
| 2018 | $2,409 | $72,120 | $11,200 | $60,920 |
| 2016 | $2,220 | $62,400 | $8,000 | $54,400 |
| 2015 | $1,701 | $44,720 | $8,000 | $36,720 |
| 2014 | $1,709 | $44,720 | $8,000 | $36,720 |
Source: Public Records
Map
Nearby Homes
- 4616 Lenora Church Rd
- 4596 Lenora Church Rd
- 4567 Eon Ct
- 3331 Metro Way
- 4705 Duration Ct
- 4680 Duval Point Way SW
- 5009 Duval Point Way SW
- 4810 Lenora Church Rd
- 3331 Glen Summit Ln
- 4390 Inns Brook Dr
- 3892 Rosebud Park Dr
- 3516 Iron Hearth Bend Unit 98C
- 3516 Iron Hearth Bend
- 3526 Iron Hearth Bend Unit 97C
- 3526 Iron Hearth Bend
- 3527 Iron Hearth Bend
- 3527 Iron Hearth Bend Unit 112A
- 3536 Iron Hearth Bend
- 3536 Iron Hearth Bend Unit 96C
- 3537 Iron Hearth Bend Unit 111A
- 4380 Millenium View Ct
- 4370 Millenium View Ct Unit 13
- 4370 Millenium View Ct
- 4390 Millenium View Ct
- 4360 Millenium View Ct
- 4659 Centurian Way View Unit 22B
- 4659 Centurian Way View
- 4659 Centurian Way
- 4400 Millenium View Ct SW
- 4400 Millenium View Ct
- 4649 Centurian Way View
- 4659 Centurian Way View SW
- 4669 Centurian
- 4669 Centurian Way View
- 4375 Millenium View Ct Unit 6
- 4375 Millenium View Ct
- 4385 Millenium View Ct
- 4669 Centurian Way View SW
- 4365 Millenium View Ct
- 4639 Centurian Way View