Estimated Value: $445,000 - $494,000
3
Beds
3
Baths
1,542
Sq Ft
$300/Sq Ft
Est. Value
About This Home
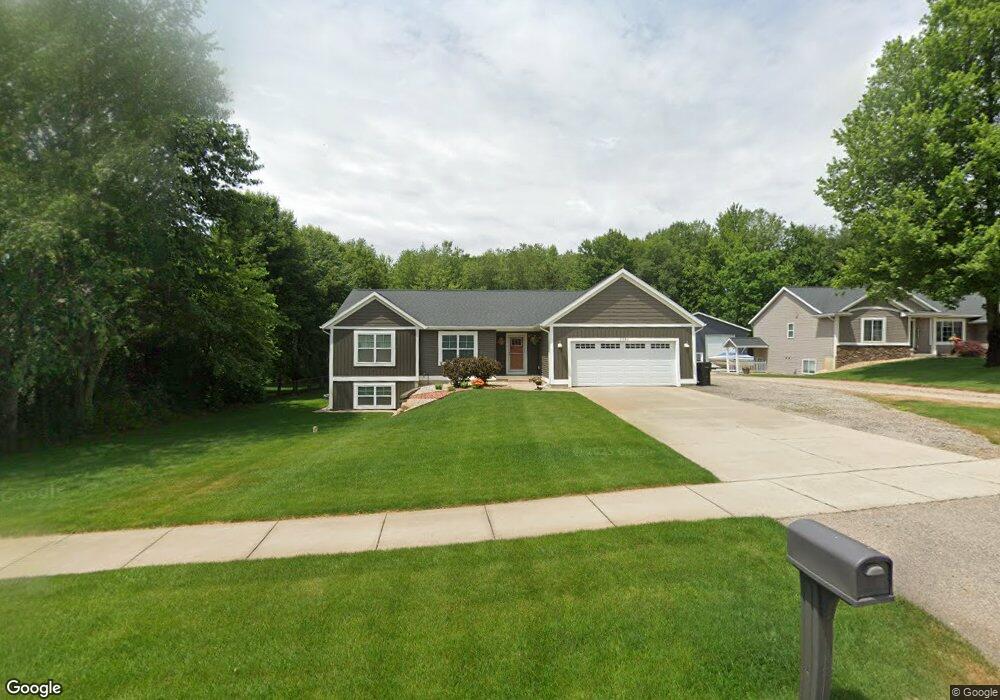
This home is located at 4380 Pleasantview Ln, Dorr, MI 49323 and is currently estimated at $461,939, approximately $299 per square foot. 4380 Pleasantview Ln is a home located in Allegan County with nearby schools including Wayland High School, Byron Center Charter School, and Moline Christian School.
Ownership History
Date
Name
Owned For
Owner Type
Purchase Details
Closed on
Jan 17, 2020
Sold by
Crow Derek and Crow Kristina
Bought by
Crow Kristina
Current Estimated Value
Home Financials for this Owner
Home Financials are based on the most recent Mortgage that was taken out on this home.
Original Mortgage
$194,000
Outstanding Balance
$171,835
Interest Rate
3.73%
Mortgage Type
New Conventional
Estimated Equity
$290,104
Purchase Details
Closed on
Sep 12, 2016
Sold by
Geers Brothers Builders Inc
Bought by
Crow Derek and Crow Kristina
Home Financials for this Owner
Home Financials are based on the most recent Mortgage that was taken out on this home.
Original Mortgage
$206,600
Interest Rate
3.43%
Mortgage Type
New Conventional
Purchase Details
Closed on
Aug 25, 2016
Sold by
Schaendorf William J
Bought by
Geers Brothers Builders Inc
Home Financials for this Owner
Home Financials are based on the most recent Mortgage that was taken out on this home.
Original Mortgage
$206,600
Interest Rate
3.43%
Mortgage Type
New Conventional
Create a Home Valuation Report for This Property
The Home Valuation Report is an in-depth analysis detailing your home's value as well as a comparison with similar homes in the area
Home Values in the Area
Average Home Value in this Area
Purchase History
| Date | Buyer | Sale Price | Title Company |
|---|---|---|---|
| Crow Kristina | -- | Chicago Title Of Mi Inc | |
| Crow Derek | $228,500 | Trans Grandville | |
| Geers Brothers Builders Inc | $35,000 | Chicago Title |
Source: Public Records
Mortgage History
| Date | Status | Borrower | Loan Amount |
|---|---|---|---|
| Open | Crow Kristina | $194,000 | |
| Closed | Crow Derek | $206,600 |
Source: Public Records
Tax History
| Year | Tax Paid | Tax Assessment Tax Assessment Total Assessment is a certain percentage of the fair market value that is determined by local assessors to be the total taxable value of land and additions on the property. | Land | Improvement |
|---|---|---|---|---|
| 2025 | $4,606 | $218,300 | $22,000 | $196,300 |
| 2024 | $4,172 | $210,200 | $17,500 | $192,700 |
| 2023 | $4,274 | $178,100 | $17,500 | $160,600 |
| 2022 | $4,172 | $162,600 | $17,500 | $145,100 |
| 2021 | $3,618 | $137,000 | $17,500 | $119,500 |
| 2020 | $3,442 | $134,200 | $17,500 | $116,700 |
| 2019 | $3,442 | $129,800 | $17,500 | $112,300 |
| 2018 | $3,364 | $110,300 | $17,500 | $92,800 |
| 2017 | $0 | $113,900 | $17,500 | $96,400 |
| 2016 | $0 | $15,500 | $15,500 | $0 |
| 2015 | -- | $15,500 | $15,500 | $0 |
| 2014 | -- | $16,000 | $16,000 | $0 |
| 2013 | -- | $16,000 | $16,000 | $0 |
Source: Public Records
Map
Nearby Homes
- 1341 142nd Ave
- Lots A&B 142nd Ave
- 4087 Gene Ct
- 4035 Patti Rd
- 4069 21st St
- 4335 Tavistock Dr
- 4316 Sussex Place
- 1125 Russell St
- 4273 Highpoint Dr Unit 112
- 4269 Highpoint Dr Unit 114
- 4271 Highpoint Dr Unit 113
- 4294 Highpoint Dr Unit 103
- 1069 Sunnyside Dr
- 4279 Highpoint Dr
- 4249 Butternut Dr
- 4245 Butternut Dr
- Lot 131 Butternut Dr
- 136 100th St SW
- 737 100th St SW
- Lot 120 Old Farm Dr
- 4384 Pleasantview Ln
- 4376 Pleasentview Ln
- 4376 Pleasantview Ln
- 4372 Pleasentview Ln
- 4372 Pleasantview Ln
- 4388 Pleasantview Ln
- 4383 Pleasantview Ln
- 4379 Pleasantview Ln
- 4375 Pleasantview Ln
- 4387 Pleasantview Ln
- 4383 Pleasentview Ln
- 4375 Pleasentview Ln
- 1675 Nelson Ct Unit 4
- 4368 Pleasantview Ln
- 4368 Pleasentview Ln
- 4371 Pleasentview Ln
- 4371 Pleasantview Ln
- 1679 Nelson Ct Unit 3
- 1664 144th Ave
- 1680 144th Ave
Your Personal Tour Guide
Ask me questions while you tour the home.