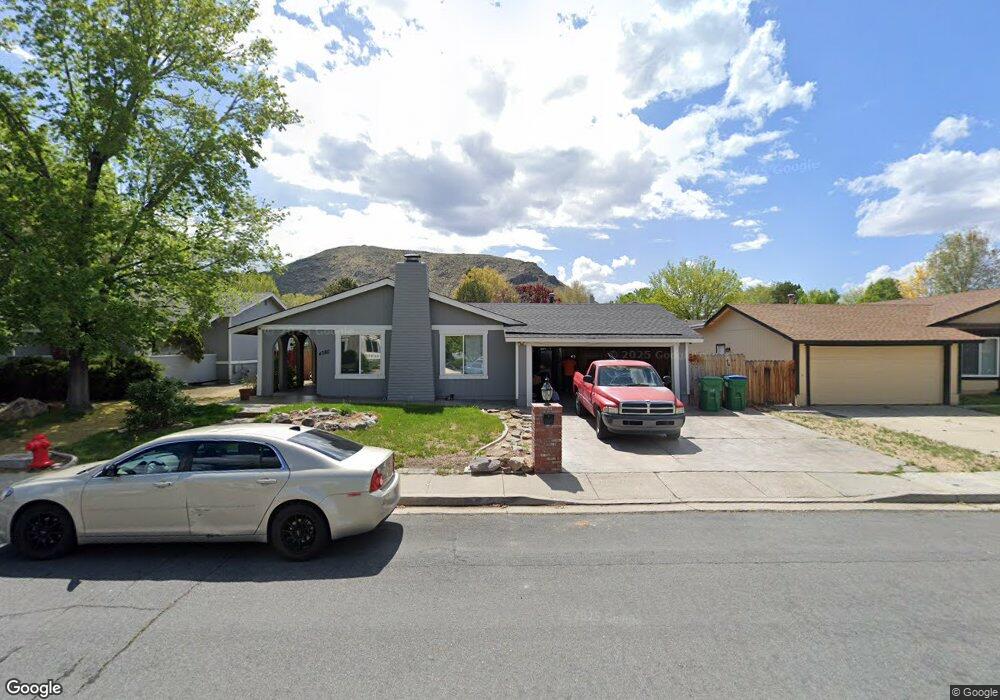
4380 Reggie Rd Reno, NV 89502
Hidden Valley NeighborhoodEstimated Value: $494,060 - $546,000
4
Beds
2
Baths
1,910
Sq Ft
$269/Sq Ft
Est. Value
About This Home
This home is located at 4380 Reggie Rd, Reno, NV 89502 and is currently estimated at $513,015, approximately $268 per square foot. 4380 Reggie Rd is a home located in Washoe County with nearby schools including Donner Springs Elementary School, Edward L Pine Middle School, and Damonte Ranch High School.
Ownership History
Date
Name
Owned For
Owner Type
Purchase Details
Closed on
Dec 11, 2006
Sold by
Lopez Mercedes and Lopez Marlon
Bought by
Lopez Marlon and Lopez Mercedes
Current Estimated Value
Home Financials for this Owner
Home Financials are based on the most recent Mortgage that was taken out on this home.
Original Mortgage
$185,000
Interest Rate
6.32%
Mortgage Type
New Conventional
Purchase Details
Closed on
Apr 16, 2002
Sold by
Lopez Marlon and Lopez Mercedes
Bought by
Lopez Marlon and Lopez Mercedes
Home Financials for this Owner
Home Financials are based on the most recent Mortgage that was taken out on this home.
Original Mortgage
$137,064
Interest Rate
6.94%
Mortgage Type
FHA
Purchase Details
Closed on
May 31, 2000
Sold by
Schurman Lyle Daniel and Schurman Roberta Jo
Bought by
Lopez Marlon and Zuniga Mercedes
Home Financials for this Owner
Home Financials are based on the most recent Mortgage that was taken out on this home.
Original Mortgage
$139,070
Interest Rate
8.18%
Mortgage Type
FHA
Create a Home Valuation Report for This Property
The Home Valuation Report is an in-depth analysis detailing your home's value as well as a comparison with similar homes in the area
Home Values in the Area
Average Home Value in this Area
Purchase History
| Date | Buyer | Sale Price | Title Company |
|---|---|---|---|
| Lopez Marlon | -- | First Centennial Title Co | |
| Lopez Marlon | -- | Stewart Title Northern Nevad | |
| Lopez Marlon | $140,000 | Stewart Title Northern Nevad |
Source: Public Records
Mortgage History
| Date | Status | Borrower | Loan Amount |
|---|---|---|---|
| Closed | Lopez Marlon | $185,000 | |
| Closed | Lopez Marlon | $137,064 | |
| Closed | Lopez Marlon | $139,070 |
Source: Public Records
Tax History Compared to Growth
Tax History
| Year | Tax Paid | Tax Assessment Tax Assessment Total Assessment is a certain percentage of the fair market value that is determined by local assessors to be the total taxable value of land and additions on the property. | Land | Improvement |
|---|---|---|---|---|
| 2025 | $2,208 | $69,961 | $37,135 | $32,826 |
| 2024 | $2,208 | $66,494 | $32,550 | $33,944 |
| 2023 | $2,045 | $67,221 | $34,230 | $32,991 |
| 2022 | $1,894 | $56,575 | $28,420 | $28,155 |
| 2021 | $1,755 | $49,276 | $20,650 | $28,626 |
| 2020 | $1,650 | $49,923 | $20,650 | $29,273 |
| 2019 | $1,572 | $49,841 | $20,965 | $28,876 |
| 2018 | $1,500 | $43,577 | $14,805 | $28,772 |
| 2017 | $1,457 | $43,178 | $13,860 | $29,318 |
| 2016 | $1,420 | $41,716 | $11,340 | $30,376 |
| 2015 | $1,417 | $41,093 | $10,115 | $30,978 |
| 2014 | $1,376 | $39,118 | $8,890 | $30,228 |
| 2013 | -- | $36,354 | $6,300 | $30,054 |
Source: Public Records
Map
Nearby Homes
- 4525 Dos Rios Ct
- 4465 Boca Way Unit 36
- 4465 Boca Way Unit 22
- 4465 Boca Way Unit 31
- 4465 Boca Way Unit 177
- 4465 Boca Way Unit 173
- 4465 Boca Way
- 4465 Boca Way Unit 220
- 4577 Reggie Rd Unit 22
- 4120 Vivian Ct
- 4405 Mesa Grande Ct
- 4593 Reggie Rd
- 4550 Noche Ln
- 4769 Reggie Rd Unit 254
- 4777 Reggie Rd Unit 255
- 4801 Reggie Rd Unit 278
- 4550 Rio Poco Rd
- 4580 Matich Dr Unit 92
- 4491 Creekside Cir
- 4634 Rio Poco Rd Unit 68