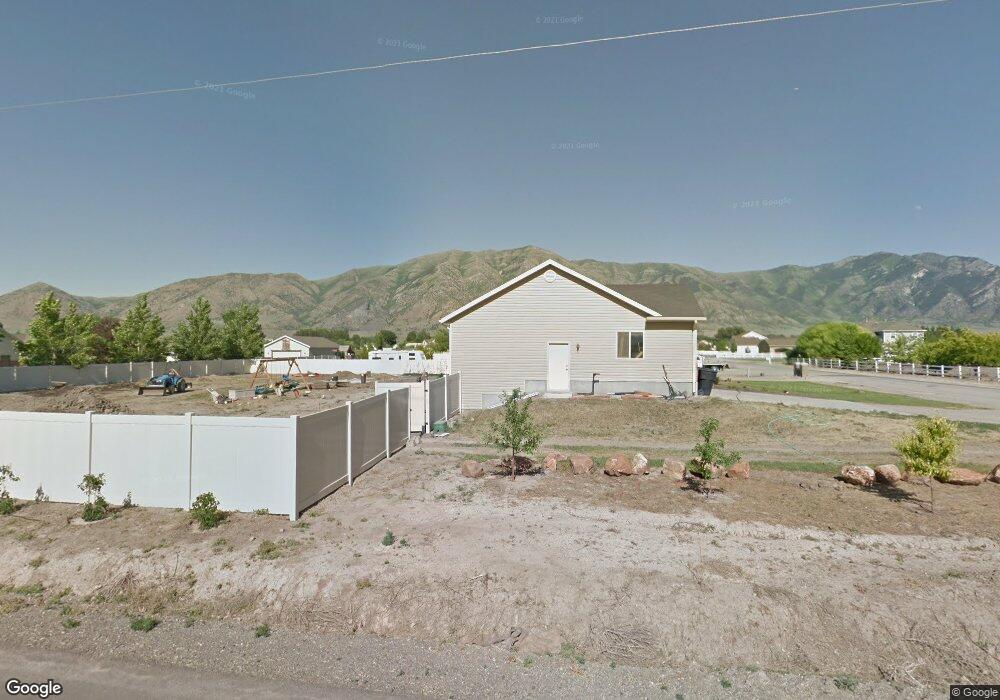
4380 W 9460 N Tremonton, UT 84337
Estimated Value: $500,000 - $591,000
2
Beds
2
Baths
3,066
Sq Ft
$176/Sq Ft
Est. Value
About This Home
This home is located at 4380 W 9460 N, Tremonton, UT 84337 and is currently estimated at $540,337, approximately $176 per square foot. 4380 W 9460 N is a home located in Box Elder County with nearby schools including McKinley School, Bear River Middle School, and Alice C. Harris Intermediate School.
Ownership History
Date
Name
Owned For
Owner Type
Purchase Details
Closed on
Apr 1, 2011
Sold by
Secretary Of Hud
Bought by
Larson Kevin B and Larson Cheryl R
Current Estimated Value
Home Financials for this Owner
Home Financials are based on the most recent Mortgage that was taken out on this home.
Original Mortgage
$129,600
Outstanding Balance
$90,078
Interest Rate
4.96%
Mortgage Type
New Conventional
Estimated Equity
$450,259
Purchase Details
Closed on
Aug 30, 2010
Sold by
Bac Home Loans Servicing Lp
Bought by
Secretary Of Hud
Purchase Details
Closed on
Oct 6, 2008
Sold by
Taylor Michael B and Taylor Christy A
Bought by
Taylor Michael B and Taylor Christy
Home Financials for this Owner
Home Financials are based on the most recent Mortgage that was taken out on this home.
Original Mortgage
$211,120
Interest Rate
6.43%
Mortgage Type
FHA
Purchase Details
Closed on
Oct 1, 2008
Sold by
Taylor Michael B and Taylor Christy
Bought by
Taylor Michael B and Taylor Christy
Home Financials for this Owner
Home Financials are based on the most recent Mortgage that was taken out on this home.
Original Mortgage
$211,120
Interest Rate
6.43%
Mortgage Type
FHA
Create a Home Valuation Report for This Property
The Home Valuation Report is an in-depth analysis detailing your home's value as well as a comparison with similar homes in the area
Home Values in the Area
Average Home Value in this Area
Purchase History
| Date | Buyer | Sale Price | Title Company |
|---|---|---|---|
| Larson Kevin B | -- | Monument Title Insurance Inc | |
| Secretary Of Hud | -- | -- | |
| Taylor Michael B | -- | -- | |
| Taylor Michael B | -- | -- |
Source: Public Records
Mortgage History
| Date | Status | Borrower | Loan Amount |
|---|---|---|---|
| Open | Larson Kevin B | $129,600 | |
| Previous Owner | Taylor Michael B | $211,120 |
Source: Public Records
Tax History Compared to Growth
Tax History
| Year | Tax Paid | Tax Assessment Tax Assessment Total Assessment is a certain percentage of the fair market value that is determined by local assessors to be the total taxable value of land and additions on the property. | Land | Improvement |
|---|---|---|---|---|
| 2025 | $2,259 | $477,581 | $130,000 | $347,581 |
| 2024 | $2,259 | $482,643 | $128,000 | $354,643 |
| 2023 | $2,237 | $487,710 | $135,000 | $352,710 |
| 2022 | $2,114 | $235,244 | $27,500 | $207,744 |
| 2021 | $1,813 | $305,879 | $50,000 | $255,879 |
| 2020 | $1,766 | $305,879 | $50,000 | $255,879 |
| 2019 | $1,212 | $109,439 | $25,341 | $84,098 |
| 2018 | $1,293 | $109,439 | $25,341 | $84,098 |
| 2017 | $1,341 | $198,980 | $25,341 | $152,905 |
| 2016 | $1,327 | $105,434 | $25,341 | $80,093 |
| 2015 | $1,215 | $98,153 | $25,341 | $72,812 |
| 2014 | $1,215 | $94,686 | $25,341 | $69,345 |
| 2013 | -- | $94,686 | $25,341 | $69,345 |
Source: Public Records
Map
Nearby Homes
- 4693 W 9120 N
- 9449 N Powerline Rd Unit 2
- 9290 N 5600 W Unit 5
- 9270 N 5600 W Unit 7
- 9480 N 5600 W
- Emerson 1797 Plan at The Estates At Riverview - The Estates
- Ridge Plan at The Estates At Riverview - The Estates
- 8185 N 4600 W
- 9605 N Highway 38
- 8325 N 3600 W
- 4677 W 8100 N
- 9190 N 6000 W
- 1215 S 100 E
- 50 E 1225 S
- Harvest Village Plan at Harvest Village Townhome Community - Harvest Village
- 10135 N Highway 38
- 181 W 1300 S Unit 31
- 1143 S 150 W
- 208 W 1300 S
- 101 W 930 S