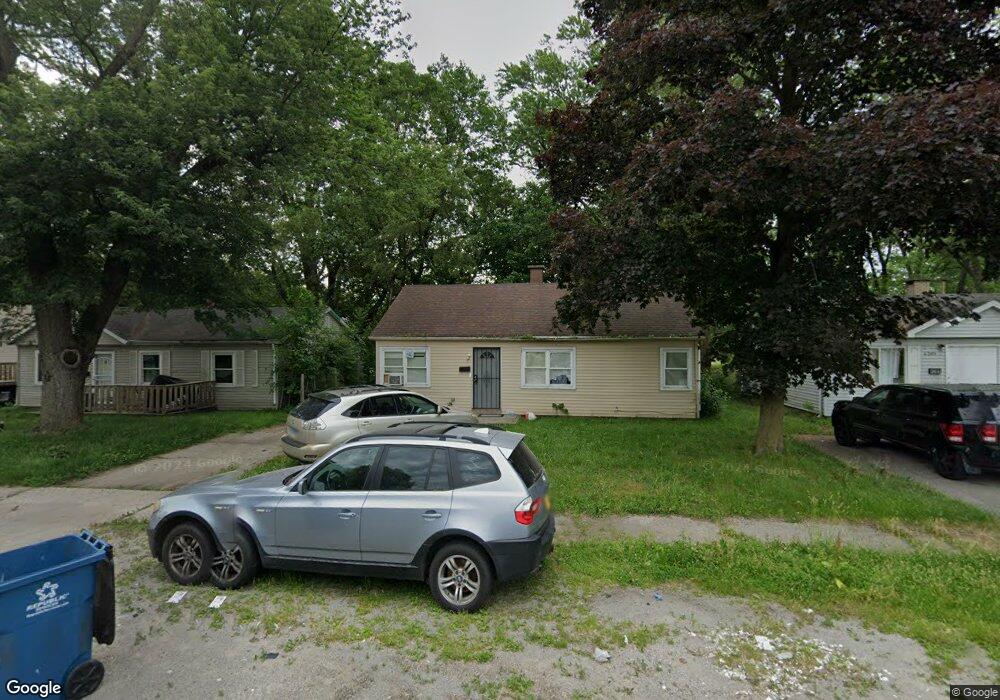
4381 Grant St Gary, IN 46408
Glen Park NeighborhoodEstimated Value: $90,000 - $159,000
3
Beds
1
Bath
925
Sq Ft
$130/Sq Ft
Est. Value
About This Home
This home is located at 4381 Grant St, Gary, IN 46408 and is currently estimated at $119,946, approximately $129 per square foot. 4381 Grant St is a home located in Lake County with nearby schools including Glen Park Academy for Excellence in Learning, Bailly Preparatory Academy, and West Side Leadership Academy.
Ownership History
Date
Name
Owned For
Owner Type
Purchase Details
Closed on
Nov 29, 2023
Sold by
Annointed Rental Properties Llc
Bought by
4381 Grant Llc
Current Estimated Value
Purchase Details
Closed on
Aug 24, 2023
Sold by
Curtis Detrick
Bought by
Annointed Rental Properties Llc
Purchase Details
Closed on
Jul 2, 2017
Sold by
Krawczenia Nick
Bought by
Curtis Detrick
Purchase Details
Closed on
Oct 22, 2014
Sold by
Krawczenia David A
Bought by
Keawczenia Nick
Purchase Details
Closed on
Oct 6, 2010
Sold by
Whttp Llc
Bought by
Krawczenia David A
Purchase Details
Closed on
Sep 24, 2010
Sold by
U S Bank National Association
Bought by
Whttp Llc
Purchase Details
Closed on
Aug 6, 2010
Sold by
Oluka Ikea S
Bought by
Us Bank National Association
Purchase Details
Closed on
Aug 2, 2005
Sold by
Hud
Bought by
Oluka Ikea S
Purchase Details
Closed on
Jan 5, 2005
Sold by
Mercantile National Bank Of Indiana
Bought by
Hud
Create a Home Valuation Report for This Property
The Home Valuation Report is an in-depth analysis detailing your home's value as well as a comparison with similar homes in the area
Home Values in the Area
Average Home Value in this Area
Purchase History
| Date | Buyer | Sale Price | Title Company |
|---|---|---|---|
| 4381 Grant Llc | -- | None Listed On Document | |
| Annointed Rental Properties Llc | -- | None Listed On Document | |
| Curtis Detrick | -- | None Available | |
| Keawczenia Nick | -- | None Available | |
| Krawczenia David A | -- | Meridian Title Corp | |
| Whttp Llc | -- | Meridian Title Corp | |
| Us Bank National Association | $16,282 | None Available | |
| Oluka Ikea S | -- | Contract Processing & Title | |
| Hud | -- | -- |
Source: Public Records
Tax History
| Year | Tax Paid | Tax Assessment Tax Assessment Total Assessment is a certain percentage of the fair market value that is determined by local assessors to be the total taxable value of land and additions on the property. | Land | Improvement |
|---|---|---|---|---|
| 2025 | $486 | $58,900 | $11,300 | $47,600 |
| 2024 | $2,989 | $35,700 | $11,200 | $24,500 |
| 2023 | $348 | $33,900 | $11,200 | $22,700 |
| 2022 | $348 | $30,400 | $7,500 | $22,900 |
| 2021 | $327 | $28,500 | $7,500 | $21,000 |
| 2020 | $313 | $27,300 | $7,500 | $19,800 |
| 2019 | $521 | $30,000 | $7,600 | $22,400 |
| 2018 | $773 | $31,500 | $7,700 | $23,800 |
| 2017 | $775 | $31,000 | $7,700 | $23,300 |
| 2016 | $791 | $32,200 | $7,700 | $24,500 |
| 2014 | $798 | $34,100 | $9,100 | $25,000 |
| 2013 | $769 | $34,200 | $9,100 | $25,100 |
Source: Public Records
Map
Nearby Homes
- 4301 Johnson St
- 4601 Buchanan St
- 4181 Fillmore St
- 4556 Polk St
- 4673 Arthur St
- 4017 Polk St
- 1645 W 40th Ave
- 4525 Tyler St
- 4056 Cleveland St
- 4034 Fillmore St
- 4317 Harrison St
- 4401 W Taft St
- 4177 Oak Ln
- 4265 Van Buren St
- 4257 Van Buren St
- 3940 Pierce St
- 4300 Roosevelt Place
- 4647 Harrison St
- 1301 W Ridge Rd
- 4383 Monroe St
- 4381 Richard Gordon Hatcher Blvd
- 4373 Grant St
- 4389 Grant St
- 4369 Grant St
- 4380 Johnson St
- 4359 Grant St
- 4374 Johnson St
- 4405 Grant St
- 4380 Grant St
- 4366 Johnson St
- 4384 Grant St
- 4390 Grant St
- 4349 Grant St
- 4370 Grant St
- 4400 Johnson St
- 4352 Johnson St
- 4413 Grant St
- 4360 Grant St
- 4341 Grant St
- 4410 Johnson St
Your Personal Tour Guide
Ask me questions while you tour the home.