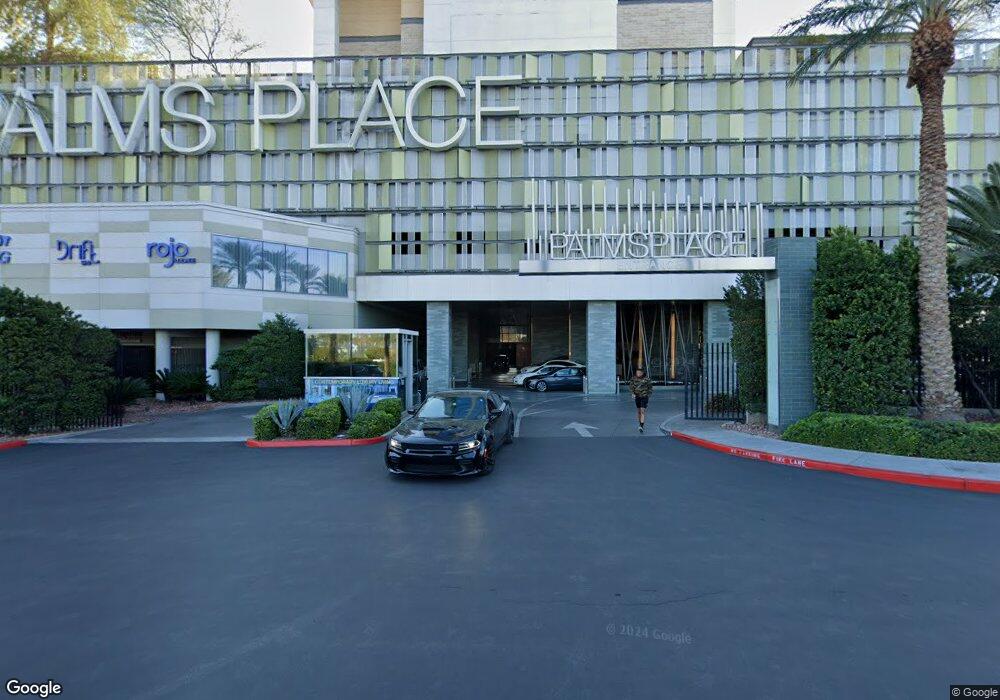
4381 W Flamingo Rd Unit 1210 Las Vegas, NV 89103
West of the Strip NeighborhoodEstimated Value: $241,883 - $265,000
1
Bed
1
Bath
615
Sq Ft
$415/Sq Ft
Est. Value
About This Home
This home is located at 4381 W Flamingo Rd Unit 1210, Las Vegas, NV 89103 and is currently estimated at $255,471, approximately $415 per square foot. 4381 W Flamingo Rd Unit 1210 is a home located in Clark County with nearby schools including Joseph E Thiriot Elementary School, Grant Sawyer Middle School, and Ed W Clark High School.
Ownership History
Date
Name
Owned For
Owner Type
Purchase Details
Closed on
Apr 17, 2019
Sold by
Michelman Kenneth T
Bought by
Michelman Kenneth Thomas and Kenneth Michelman Trust
Current Estimated Value
Purchase Details
Closed on
Mar 25, 2014
Sold by
Ko Sam and Ko Francesca
Bought by
Michelman Kenneth T
Purchase Details
Closed on
Nov 8, 2011
Sold by
Jw Equity Llc
Bought by
Ko Sam and Ko Francesca
Purchase Details
Closed on
Oct 7, 2011
Sold by
Mermaidutp Llc
Bought by
J W Equity Llc
Purchase Details
Closed on
Mar 12, 2008
Sold by
Palms Place Llc
Bought by
Mermaidutp Llc
Home Financials for this Owner
Home Financials are based on the most recent Mortgage that was taken out on this home.
Original Mortgage
$412,500
Interest Rate
5.99%
Mortgage Type
Purchase Money Mortgage
Create a Home Valuation Report for This Property
The Home Valuation Report is an in-depth analysis detailing your home's value as well as a comparison with similar homes in the area
Home Values in the Area
Average Home Value in this Area
Purchase History
| Date | Buyer | Sale Price | Title Company |
|---|---|---|---|
| Michelman Kenneth Thomas | -- | None Available | |
| Michelman Kenneth T | $171,500 | Nevada Title Las Vegas | |
| Ko Sam | $145,000 | Noble Title | |
| J W Equity Llc | $110,971 | Nevada Title Las Vegas | |
| Mermaidutp Llc | $539,720 | Stewart Title Of Nevada |
Source: Public Records
Mortgage History
| Date | Status | Borrower | Loan Amount |
|---|---|---|---|
| Previous Owner | Mermaidutp Llc | $412,500 |
Source: Public Records
Tax History Compared to Growth
Tax History
| Year | Tax Paid | Tax Assessment Tax Assessment Total Assessment is a certain percentage of the fair market value that is determined by local assessors to be the total taxable value of land and additions on the property. | Land | Improvement |
|---|---|---|---|---|
| 2025 | $2,445 | $87,400 | $31,805 | $55,595 |
| 2024 | $2,140 | $87,400 | $31,805 | $55,595 |
| 2023 | $2,069 | $80,679 | $30,513 | $50,166 |
| 2022 | $1,911 | $71,391 | $25,778 | $45,613 |
| 2021 | $1,823 | $68,275 | $23,410 | $44,865 |
| 2020 | $1,881 | $68,595 | $23,410 | $45,185 |
| 2019 | $1,763 | $66,763 | $23,410 | $43,353 |
| 2018 | $1,682 | $60,781 | $17,624 | $43,157 |
| 2017 | $1,805 | $61,533 | $17,624 | $43,909 |
| 2016 | $1,575 | $57,862 | $15,575 | $42,287 |
| 2015 | $1,571 | $53,728 | $15,575 | $38,153 |
| 2014 | $1,522 | $50,426 | $15,575 | $34,851 |
Source: Public Records
Map
Nearby Homes
- 4381 W Flamingo Rd Unit 8304
- 4381 W Flamingo Rd Unit 2309
- 4381 W Flamingo Rd Unit 11308
- 4381 W Flamingo Rd Unit 10038
- 4381 W Flamingo Rd Unit 3616
- 4381 W Flamingo Rd Unit 1508
- 4381 W Flamingo Rd Unit 18320
- 4381 W Flamingo Rd Unit 2716
- 4381 W Flamingo Rd Unit 908
- 4381 W Flamingo Rd Unit 1206
- 4381 W Flamingo Rd Unit 17310
- 4381 W Flamingo Rd Unit 5219
- 4381 W Flamingo Rd Unit 3819
- 4381 W Flamingo Rd Unit 5806
- 4381 W Flamingo Rd Unit 16310
- 4381 W Flamingo Rd Unit 38303
- 4381 W Flamingo Rd Unit 3402/3404
- 4381 W Flamingo Rd Unit 3116
- 4381 W Flamingo Rd Unit 1903
- 4381 W Flamingo Rd Unit 1207
- 4381 W Flamingo Rd Unit 1906
- 4381 W Flamingo Rd Unit 3807
- 4381 W Flamingo Rd Unit 12321
- 4381 W Flamingo Rd Unit 2701
- 4381 W Flamingo Rd Unit 2305
- 4381 W Flamingo Rd Unit 11302&11304
- 4381 W Flamingo Rd Unit 31301
- 4381 W Flamingo Rd Unit 3802
- 4381 W Flamingo Rd Unit 52321
- 4381 W Flamingo Rd Unit 32320
- 4381 W Flamingo Rd Unit 18301
- 4381 W Flamingo Rd Unit 22307
- 4381 W Flamingo Rd Unit 8318
- 4381 W Flamingo Rd Unit 26302
- 4381 W Flamingo Rd Unit 3709
- 4381 W Flamingo Rd Unit 2719
- 4381 W Flamingo Rd Unit 809
- 4381 W Flamingo Rd Unit 31302
- 4381 W Flamingo Rd Unit 5105
- 4381 W Flamingo Rd Unit 52-2&4