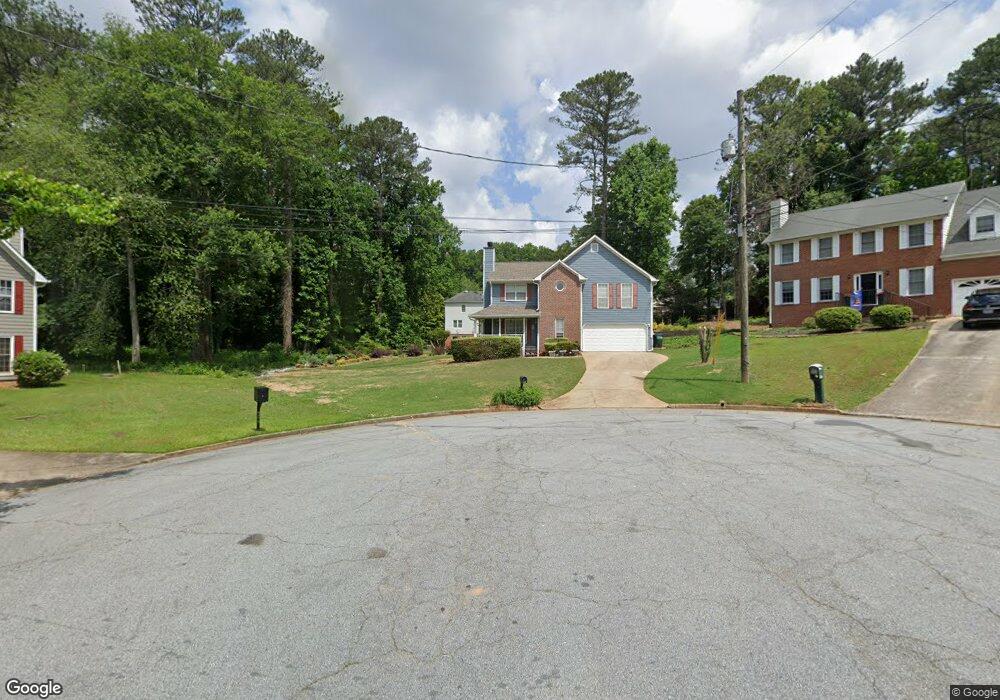
4382 Deer Ridge Ct SW Unit 1 Lilburn, GA 30047
Estimated Value: $369,000 - $392,000
3
Beds
3
Baths
1,854
Sq Ft
$204/Sq Ft
Est. Value
About This Home
This home is located at 4382 Deer Ridge Ct SW Unit 1, Lilburn, GA 30047 and is currently estimated at $378,080, approximately $203 per square foot. 4382 Deer Ridge Ct SW Unit 1 is a home located in Gwinnett County with nearby schools including Knight Elementary School, Trickum Middle School, and Parkview High School.
Ownership History
Date
Name
Owned For
Owner Type
Purchase Details
Closed on
Aug 28, 2006
Sold by
Hobson Ashley
Bought by
Metcalf Travis and Martin Amanda
Current Estimated Value
Home Financials for this Owner
Home Financials are based on the most recent Mortgage that was taken out on this home.
Original Mortgage
$172,790
Outstanding Balance
$103,034
Interest Rate
6.73%
Mortgage Type
FHA
Estimated Equity
$275,046
Purchase Details
Closed on
May 8, 2002
Sold by
Wood Arthur M
Bought by
Hobson Ashley
Home Financials for this Owner
Home Financials are based on the most recent Mortgage that was taken out on this home.
Original Mortgage
$125,000
Interest Rate
7.12%
Purchase Details
Closed on
May 29, 2001
Sold by
Moore Cynthia O
Bought by
Wood Arthur M
Home Financials for this Owner
Home Financials are based on the most recent Mortgage that was taken out on this home.
Original Mortgage
$108,900
Interest Rate
7.11%
Mortgage Type
New Conventional
Create a Home Valuation Report for This Property
The Home Valuation Report is an in-depth analysis detailing your home's value as well as a comparison with similar homes in the area
Home Values in the Area
Average Home Value in this Area
Purchase History
| Date | Buyer | Sale Price | Title Company |
|---|---|---|---|
| Metcalf Travis | $175,700 | -- | |
| Hobson Ashley | $33,000 | -- | |
| Wood Arthur M | $138,900 | -- |
Source: Public Records
Mortgage History
| Date | Status | Borrower | Loan Amount |
|---|---|---|---|
| Open | Metcalf Travis | $172,790 | |
| Previous Owner | Hobson Ashley | $125,000 | |
| Previous Owner | Wood Arthur M | $108,900 |
Source: Public Records
Tax History Compared to Growth
Tax History
| Year | Tax Paid | Tax Assessment Tax Assessment Total Assessment is a certain percentage of the fair market value that is determined by local assessors to be the total taxable value of land and additions on the property. | Land | Improvement |
|---|---|---|---|---|
| 2025 | $3,691 | $133,560 | $26,120 | $107,440 |
| 2024 | $3,771 | $131,440 | $26,120 | $105,320 |
| 2023 | $3,771 | $130,440 | $27,200 | $103,240 |
| 2022 | $3,387 | $115,200 | $19,600 | $95,600 |
| 2021 | $2,954 | $92,160 | $19,600 | $72,560 |
| 2020 | $2,719 | $80,320 | $15,600 | $64,720 |
| 2019 | $2,486 | $73,080 | $15,600 | $57,480 |
| 2018 | $2,517 | $75,320 | $16,400 | $58,920 |
| 2016 | $2,221 | $61,160 | $12,000 | $49,160 |
| 2015 | $1,999 | $54,200 | $8,000 | $46,200 |
| 2014 | -- | $54,200 | $8,000 | $46,200 |
Source: Public Records
Map
Nearby Homes
- 676 Killian Hill Rd SW
- 4307 Cedar Wood Dr SW
- 4245 Cedar Creek Trail SW
- 4254 Cedar Creek Trail SW Unit 8
- 4367 Cedar Wood Dr SW
- 551 Killian Hill Rd SW
- 871 Cedar Trace SW
- 753 Brookwood Terrace SW
- 4406 Hale Dr SW
- 772 Brookwood Terrace SW
- 565 James St SW Unit 10
- 478 Dorsey Cir SW
- 4271 Weston Dr SW
- 445 Bruce Way SW
- 453 James St SW
- 383 Ben Ave SW
- 4567 Town Crier Rd SW
- 4582 Warrior Trail SW
- 4383 Deer Ridge Ct SW
- 4383 Deer Ridge Ct SW
- 0 Collie Ct SW Unit 7578499
- 0 Collie Ct SW
- 4372 Deer Ridge Ct SW
- 4252 Collie Ct SW
- 4242 Collie Ct SW
- 4262 Collie Ct SW Unit 11
- 4373 Deer Ridge Ct SW
- 4352 Deer Ridge Ct SW
- 4232 Collie Ct SW
- 4363 Deer Ridge Ct SW
- 696 Killian Hill Rd SW
- 686 Killian Hill Rd SW
- 702 Killian Hill Rd SW
- 691 Dorsey Cir SW
- 701 Dorsey Cir SW
- 676 Killian Hill Rd SW Unit 676
- 676 Killian Hill Rd SW
- 681 Dorsey Cir SW Unit 11