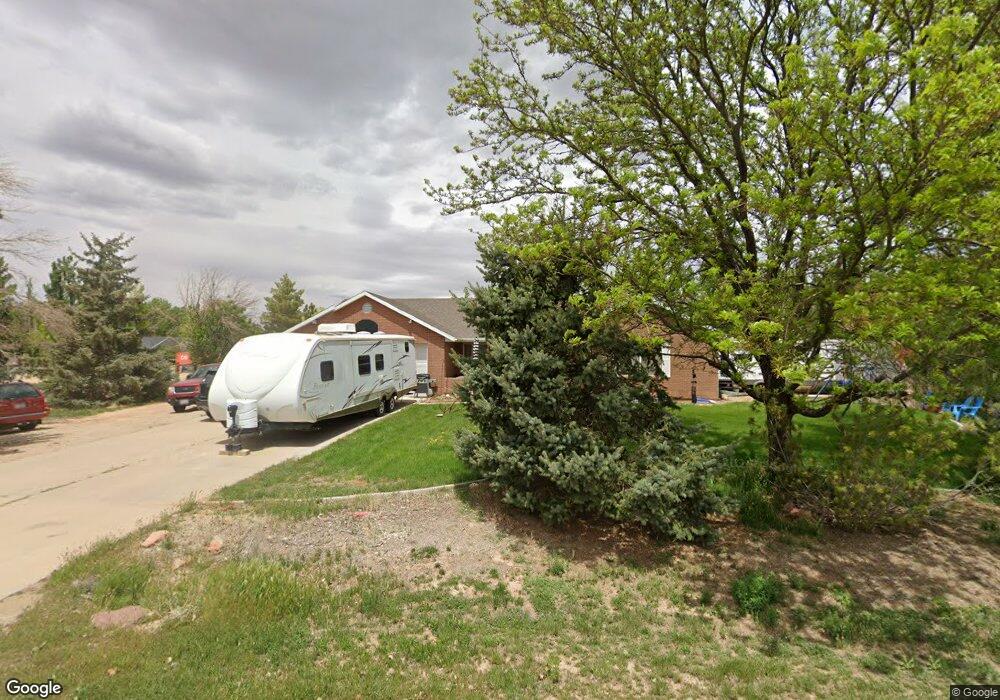
4382 W 575 N Cedar City, UT 84721
Estimated Value: $424,000 - $498,678
4
Beds
2
Baths
2,000
Sq Ft
$231/Sq Ft
Est. Value
About This Home
This home is located at 4382 W 575 N, Cedar City, UT 84721 and is currently estimated at $462,920, approximately $231 per square foot. 4382 W 575 N is a home located in Iron County with nearby schools including Iron Springs School, Cedar Middle School, and Cedar City High School.
Ownership History
Date
Name
Owned For
Owner Type
Purchase Details
Closed on
Oct 16, 2020
Sold by
Cox Lyncoin H and Cox Crystal M
Bought by
Cox Crystal M and Cox Lyncoin H
Current Estimated Value
Home Financials for this Owner
Home Financials are based on the most recent Mortgage that was taken out on this home.
Original Mortgage
$170,000
Outstanding Balance
$121,921
Interest Rate
2.8%
Mortgage Type
New Conventional
Estimated Equity
$340,999
Purchase Details
Closed on
Nov 14, 2006
Sold by
Rhea Matthew R and Rhea Kellie
Bought by
Cox Lyncolyn H and Cox Crystal M
Home Financials for this Owner
Home Financials are based on the most recent Mortgage that was taken out on this home.
Original Mortgage
$229,805
Interest Rate
6.28%
Mortgage Type
New Conventional
Create a Home Valuation Report for This Property
The Home Valuation Report is an in-depth analysis detailing your home's value as well as a comparison with similar homes in the area
Home Values in the Area
Average Home Value in this Area
Purchase History
| Date | Buyer | Sale Price | Title Company |
|---|---|---|---|
| Cox Crystal M | -- | Mountain View Ttl Cedar City | |
| Cox Lyncolyn H | -- | -- |
Source: Public Records
Mortgage History
| Date | Status | Borrower | Loan Amount |
|---|---|---|---|
| Open | Cox Crystal M | $170,000 | |
| Closed | Cox Lyncolyn H | $229,805 |
Source: Public Records
Tax History Compared to Growth
Tax History
| Year | Tax Paid | Tax Assessment Tax Assessment Total Assessment is a certain percentage of the fair market value that is determined by local assessors to be the total taxable value of land and additions on the property. | Land | Improvement |
|---|---|---|---|---|
| 2025 | $2,371 | $304,167 | $49,345 | $254,822 |
| 2023 | $2,785 | $340,675 | $78,955 | $261,720 |
| 2022 | $2,005 | $224,120 | $60,735 | $163,385 |
| 2021 | $1,611 | $180,030 | $37,960 | $142,070 |
| 2020 | $1,459 | $144,385 | $31,630 | $112,755 |
| 2019 | $1,325 | $125,745 | $27,690 | $98,055 |
| 2018 | $1,261 | $116,935 | $27,690 | $89,245 |
| 2017 | $1,123 | $104,335 | $24,920 | $79,415 |
| 2016 | $1,145 | $96,030 | $16,615 | $79,415 |
| 2015 | $1,153 | $92,205 | $0 | $0 |
| 2014 | $1,146 | $86,540 | $0 | $0 |
Source: Public Records
Map
Nearby Homes