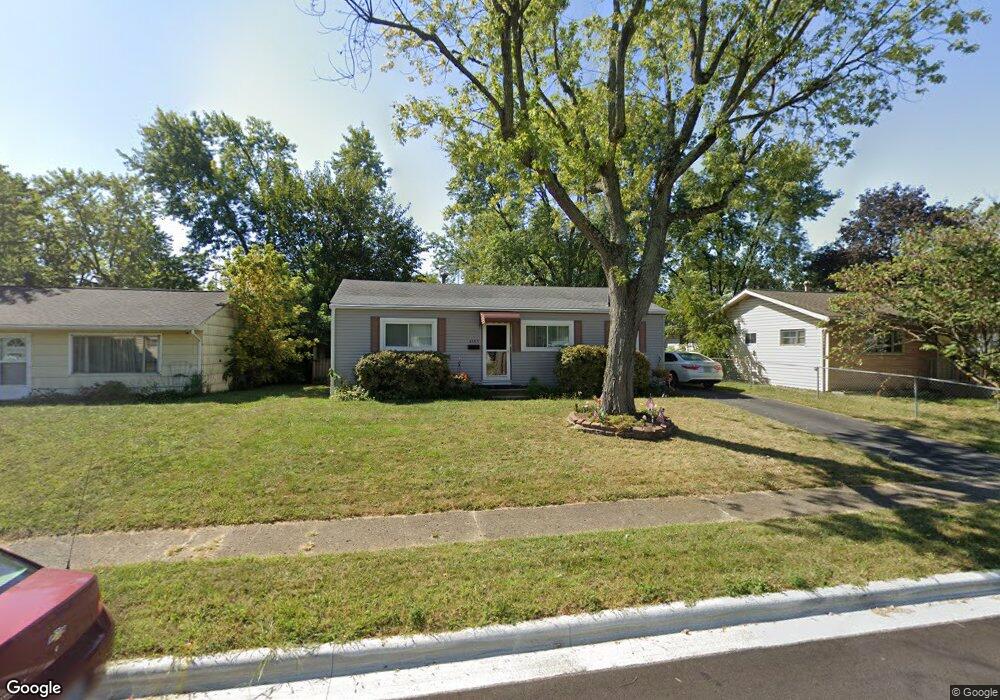
4383 Kumler Dr Columbus, OH 43213
Estimated Value: $181,269 - $210,000
3
Beds
1
Bath
1,014
Sq Ft
$198/Sq Ft
Est. Value
About This Home
This home is located at 4383 Kumler Dr, Columbus, OH 43213 and is currently estimated at $200,567, approximately $197 per square foot. 4383 Kumler Dr is a home located in Franklin County with nearby schools including Etna Road Elementary School, Beechwood Elementary School, and Rosemore Middle School.
Ownership History
Date
Name
Owned For
Owner Type
Purchase Details
Closed on
Aug 5, 2020
Sold by
Cudak Wendy L
Bought by
Cudak Wendy L and Cooper Steven Allen
Current Estimated Value
Purchase Details
Closed on
Mar 30, 2005
Sold by
Cochran Mark A
Bought by
Cudak Wendy L
Purchase Details
Closed on
Mar 28, 2005
Sold by
Nichols Carole R and Cochran Carole R
Bought by
Cochran Mark A
Purchase Details
Closed on
May 20, 1992
Create a Home Valuation Report for This Property
The Home Valuation Report is an in-depth analysis detailing your home's value as well as a comparison with similar homes in the area
Home Values in the Area
Average Home Value in this Area
Purchase History
| Date | Buyer | Sale Price | Title Company |
|---|---|---|---|
| Cudak Wendy L | -- | Landsel Title Agency Inc | |
| Cudak Wendy L | -- | Nordic | |
| Cochran Mark A | $9,161 | Nordic | |
| -- | $58,000 | -- |
Source: Public Records
Tax History Compared to Growth
Tax History
| Year | Tax Paid | Tax Assessment Tax Assessment Total Assessment is a certain percentage of the fair market value that is determined by local assessors to be the total taxable value of land and additions on the property. | Land | Improvement |
|---|---|---|---|---|
| 2024 | $2,532 | $57,930 | $14,490 | $43,440 |
| 2023 | $2,514 | $57,930 | $14,490 | $43,440 |
| 2022 | $1,897 | $33,220 | $6,200 | $27,020 |
| 2021 | $1,782 | $33,220 | $6,200 | $27,020 |
| 2020 | $1,764 | $33,220 | $6,200 | $27,020 |
| 2019 | $1,606 | $26,290 | $4,970 | $21,320 |
| 2018 | $1,589 | $26,290 | $4,970 | $21,320 |
| 2017 | $1,551 | $26,290 | $4,970 | $21,320 |
| 2016 | $1,530 | $23,420 | $5,040 | $18,380 |
| 2015 | $1,543 | $23,420 | $5,040 | $18,380 |
| 2014 | $1,543 | $23,420 | $5,040 | $18,380 |
| 2013 | $815 | $26,005 | $5,600 | $20,405 |
Source: Public Records
Map
Nearby Homes
- 579 Westphal Ave
- 451 Beaver Ave
- 4368 Broadhurst Dr
- 4489 Saint Margaret Ln
- 4148 Elbern Ave
- 571 S Hamilton Rd
- 4232 Mayflower Blvd
- 4653 Kae Ave
- 798 S Yearling Rd
- 4572 Saint Anthony Ln
- 4662 Jae Ave
- 353 Shell Ct E
- 469 Cumberland Dr
- 4780 Etna Rd Unit 782
- 4094 E Main St
- 424 Cumberland Dr
- 963 Erickson Ave
- 4144 Mcallister Ave
- 1085 S Hamilton Rd
- 3814 Elbern Ave