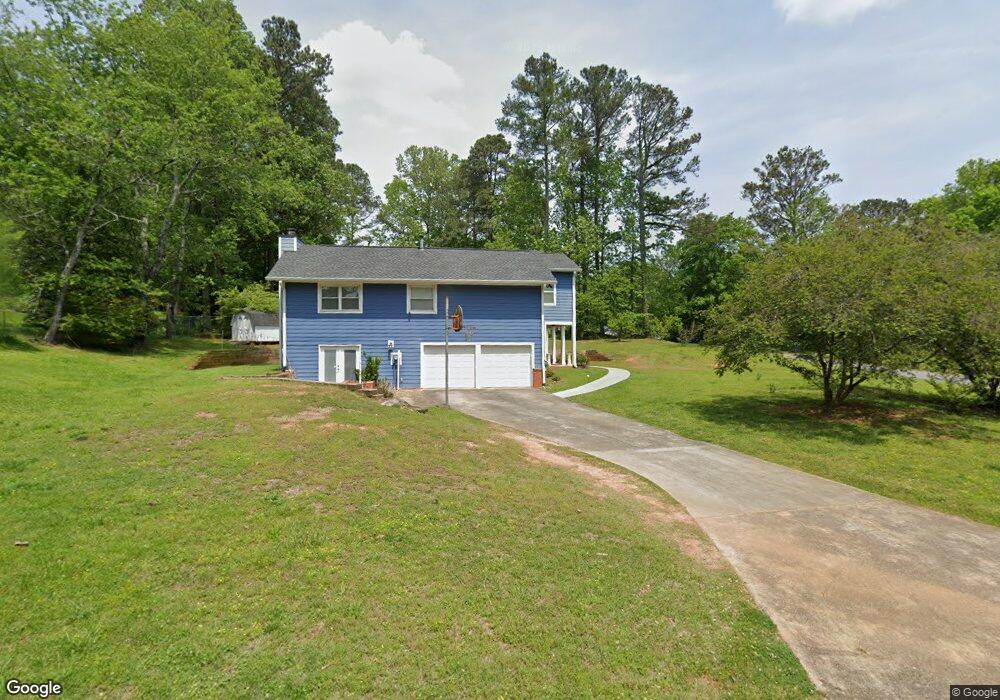
4383 Old Mabry Place NE Unit 1 Roswell, GA 30075
East Cobb NeighborhoodEstimated Value: $518,000 - $589,243
5
Beds
5
Baths
2,547
Sq Ft
$221/Sq Ft
Est. Value
About This Home
This home is located at 4383 Old Mabry Place NE Unit 1, Roswell, GA 30075 and is currently estimated at $562,311, approximately $220 per square foot. 4383 Old Mabry Place NE Unit 1 is a home located in Cobb County with nearby schools including Garrison Mill Elementary School, Mabry Middle School, and Lassiter High School.
Ownership History
Date
Name
Owned For
Owner Type
Purchase Details
Closed on
Aug 5, 2024
Sold by
Noble Debbie and Lanham Debbie Berina
Bought by
Lanham Debbie Berina Noble and Lanham Arvelle
Current Estimated Value
Home Financials for this Owner
Home Financials are based on the most recent Mortgage that was taken out on this home.
Original Mortgage
$420,000
Outstanding Balance
$414,857
Interest Rate
6.86%
Mortgage Type
New Conventional
Estimated Equity
$147,454
Purchase Details
Closed on
Jul 13, 2001
Sold by
Chesser Robert J and Jeanne As
Bought by
Hoberg Stephen L
Home Financials for this Owner
Home Financials are based on the most recent Mortgage that was taken out on this home.
Original Mortgage
$146,205
Interest Rate
7.19%
Mortgage Type
New Conventional
Create a Home Valuation Report for This Property
The Home Valuation Report is an in-depth analysis detailing your home's value as well as a comparison with similar homes in the area
Home Values in the Area
Average Home Value in this Area
Purchase History
| Date | Buyer | Sale Price | Title Company |
|---|---|---|---|
| Lanham Debbie Berina Noble | -- | None Listed On Document | |
| Hoberg Stephen L | $153,900 | -- |
Source: Public Records
Mortgage History
| Date | Status | Borrower | Loan Amount |
|---|---|---|---|
| Open | Lanham Debbie Berina Noble | $420,000 | |
| Previous Owner | Hoberg Stephen L | $146,205 |
Source: Public Records
Tax History Compared to Growth
Tax History
| Year | Tax Paid | Tax Assessment Tax Assessment Total Assessment is a certain percentage of the fair market value that is determined by local assessors to be the total taxable value of land and additions on the property. | Land | Improvement |
|---|---|---|---|---|
| 2025 | $4,936 | $215,844 | $40,000 | $175,844 |
| 2024 | $4,087 | $176,476 | $38,800 | $137,676 |
| 2023 | $3,544 | $176,476 | $38,800 | $137,676 |
| 2022 | $3,145 | $131,944 | $27,200 | $104,744 |
| 2021 | $3,145 | $131,944 | $27,200 | $104,744 |
| 2020 | $2,651 | $109,364 | $27,200 | $82,164 |
| 2019 | $2,651 | $109,364 | $27,200 | $82,164 |
| 2018 | $2,366 | $96,360 | $27,200 | $69,160 |
| 2017 | $1,734 | $71,240 | $12,800 | $58,440 |
| 2016 | $1,576 | $64,008 | $13,600 | $50,408 |
| 2015 | $1,616 | $64,008 | $13,600 | $50,408 |
| 2014 | $1,179 | $48,512 | $0 | $0 |
Source: Public Records
Map
Nearby Homes
- 4363 Old Mabry Rd NE
- 4361 Old Mabry Ln NE
- 4579 Glenforest Dr NE
- 11395 West Rd
- 4300 Inverness Ct NE Unit 1
- 11180 West Rd
- 11675 Highland Colony Dr Unit 1
- 3985 Loch Highland Pass NE
- 4209 Loch Highland Pkwy NE
- 4274 Loch Highland Pkwy NE
- 11140 West Rd
- 3865 Mabry Rd NE
- 11775 Highland Colony Dr Unit 1
- 105 Beech Tree Ln
- 11790 Highland Colony Dr
- 4019 Wesley Chapel Rd
- 4032 Wesley Chapel Rd
- 11015 Stroup Rd
- 4328 Old Mabry Place NE
- 4403 Old Mabry Place NE Unit 17
- 4403 Old Mabry Place NE
- 4380 Old Mabry Rd NE
- 4382 Old Mabry Place NE
- 4367 Old Mabry Rd NE
- 4392 Old Mabry Place NE Unit 1
- 4375 Old Mabry Rd NE
- 0 Old Mabry Rd NE Unit 7440291
- 0 Old Mabry Rd NE Unit 7245527
- 0 Old Mabry Rd NE Unit 8761204
- 0 Old Mabry Rd NE Unit 8227310
- 0 Old Mabry Rd NE Unit 8036125
- 0 Old Mabry Rd NE Unit 7552441
- 0 Old Mabry Rd NE Unit 7015474
- 4413 Old Mabry Place NE
- 4390 Old Mabry Rd NE
- 4402 Old Mabry Place NE
- 4351 Old Mabry Rd NE
- 4412 Old Mabry Place NE