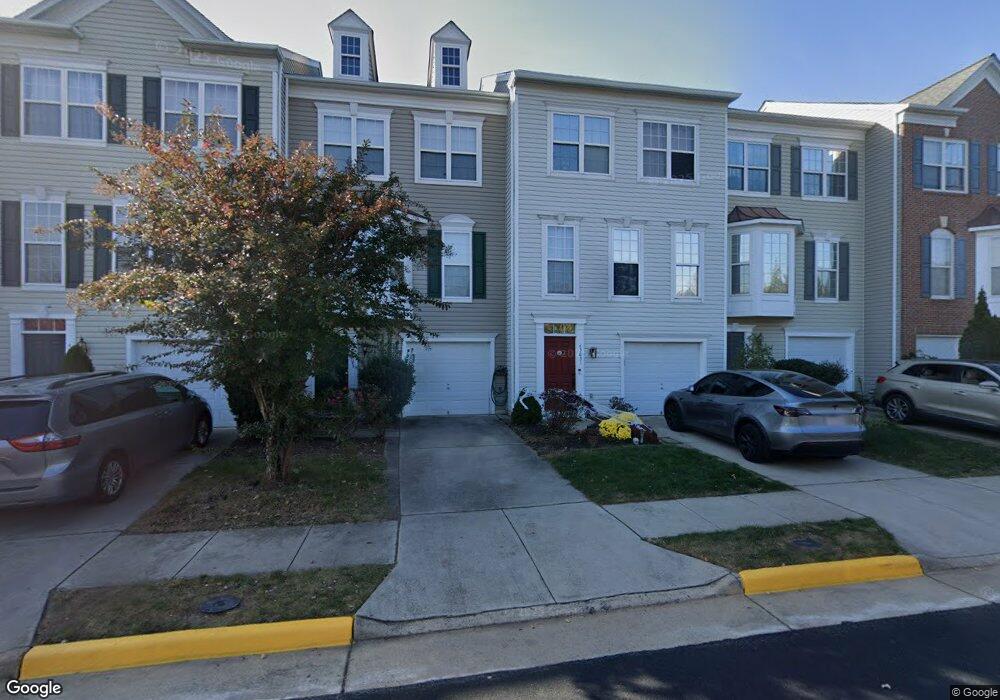
43831 Tattinger Terrace Ashburn, VA 20148
Estimated Value: $618,000 - $650,000
4
Beds
3
Baths
2,442
Sq Ft
$262/Sq Ft
Est. Value
About This Home
This home is located at 43831 Tattinger Terrace, Ashburn, VA 20148 and is currently estimated at $640,358, approximately $262 per square foot. 43831 Tattinger Terrace is a home located in Loudoun County with nearby schools including Moorefield Station Elementary School, Rock Ridge High School, and Stone Hill Middle School.
Ownership History
Date
Name
Owned For
Owner Type
Purchase Details
Closed on
Nov 12, 2008
Sold by
Bk Of New York Succ To
Bought by
Hill Jameson
Current Estimated Value
Home Financials for this Owner
Home Financials are based on the most recent Mortgage that was taken out on this home.
Original Mortgage
$290,699
Outstanding Balance
$190,350
Interest Rate
6.03%
Mortgage Type
FHA
Estimated Equity
$450,008
Purchase Details
Closed on
Jun 6, 2006
Sold by
Turnbull Wallace R
Bought by
Flynn Lorrie
Home Financials for this Owner
Home Financials are based on the most recent Mortgage that was taken out on this home.
Original Mortgage
$472,506
Interest Rate
6.62%
Mortgage Type
New Conventional
Purchase Details
Closed on
Apr 25, 2002
Sold by
Pulte Home Corp
Bought by
Turnbull Wallace R
Home Financials for this Owner
Home Financials are based on the most recent Mortgage that was taken out on this home.
Original Mortgage
$256,800
Interest Rate
7.05%
Mortgage Type
VA
Create a Home Valuation Report for This Property
The Home Valuation Report is an in-depth analysis detailing your home's value as well as a comparison with similar homes in the area
Home Values in the Area
Average Home Value in this Area
Purchase History
| Date | Buyer | Sale Price | Title Company |
|---|---|---|---|
| Hill Jameson | $294,900 | -- | |
| Flynn Lorrie | $432,500 | -- | |
| Turnbull Wallace R | $255,790 | -- |
Source: Public Records
Mortgage History
| Date | Status | Borrower | Loan Amount |
|---|---|---|---|
| Open | Hill Jameson | $290,699 | |
| Previous Owner | Flynn Lorrie | $472,506 | |
| Previous Owner | Turnbull Wallace R | $256,800 |
Source: Public Records
Tax History Compared to Growth
Tax History
| Year | Tax Paid | Tax Assessment Tax Assessment Total Assessment is a certain percentage of the fair market value that is determined by local assessors to be the total taxable value of land and additions on the property. | Land | Improvement |
|---|---|---|---|---|
| 2025 | $4,734 | $588,020 | $195,000 | $393,020 |
| 2024 | $4,875 | $563,540 | $195,000 | $368,540 |
| 2023 | $4,871 | $556,720 | $195,000 | $361,720 |
| 2022 | $4,742 | $532,780 | $185,000 | $347,780 |
| 2021 | $4,463 | $455,410 | $150,000 | $305,410 |
| 2020 | $4,428 | $427,780 | $150,000 | $277,780 |
| 2019 | $4,359 | $417,110 | $150,000 | $267,110 |
| 2018 | $4,369 | $402,700 | $125,000 | $277,700 |
| 2017 | $4,186 | $372,050 | $125,000 | $247,050 |
| 2016 | $4,162 | $363,520 | $0 | $0 |
| 2015 | $4,304 | $254,200 | $0 | $254,200 |
| 2014 | $4,218 | $250,160 | $0 | $250,160 |
Source: Public Records
Map
Nearby Homes
- 43778 Tattinger Terrace
- 43706 Hamilton Chapel Terrace
- 43700 Hamilton Chapel Terrace
- 43837 Kingston Station Terrace
- 22358 Concord Station Terrace
- 43841 Centergate Dr
- 22405 Claude Moore Dr
- 22381 Roanoke Rise Terrace
- 22361 Roanoke Rise Terrace
- 43361 Radford Divide Terrace
- 43360 Southland St
- 22317 Seabring Terrace
- 22260 Cornerstone Crossing Terrace
- 43303 John Michael Terrace
- 22275 Sims Terrace
- 43400 Apple Orchard Square
- 43116 Unison Knoll Cir
- 22143 Penelope Heights Terrace
- 43447 Croson Ln Unit 300
- 22985 Weybridge Square
- 43833 Tattinger Terrace
- 43829 Tattinger Terrace
- 43835 Tattinger Terrace
- 43827 Tattinger Terrace
- 43837 Tattinger Terrace
- 43839 Tattinger Terrace
- 43823 Tattinger Terrace
- 22698 High Haven Terrace
- 43821 Tattinger Terrace
- 22696 High Haven Terrace
- 43819 Tattinger Terrace
- 22694 High Haven Terrace
- 43817 Tattinger Terrace
- 43845 Tattinger Terrace
- 22692 High Haven Terrace
- 43815 Tattinger Terrace
- 22690 High Haven Terrace
- 43847 Tattinger Terrace
- 43813 Tattinger Terrace
- 22688 High Haven Terrace