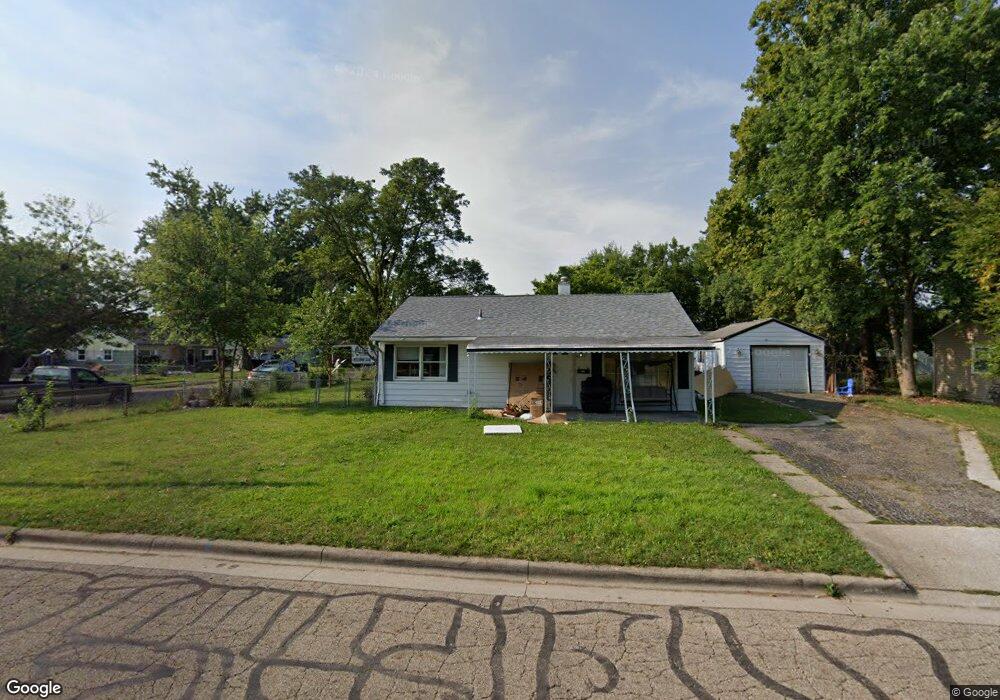
4387 Duchene Ln Columbus, OH 43213
Estimated Value: $196,000 - $220,000
3
Beds
2
Baths
1,296
Sq Ft
$161/Sq Ft
Est. Value
About This Home
This home is located at 4387 Duchene Ln, Columbus, OH 43213 and is currently estimated at $208,576, approximately $160 per square foot. 4387 Duchene Ln is a home located in Franklin County with nearby schools including Etna Road Elementary School, Beechwood Elementary School, and Rosemore Middle School.
Ownership History
Date
Name
Owned For
Owner Type
Purchase Details
Closed on
Jun 21, 2017
Sold by
U S Bank Na
Bought by
Almonte Dolly
Current Estimated Value
Purchase Details
Closed on
May 2, 2017
Sold by
Griffith Anglea J and Caudill Angela J
Bought by
Us Bank Natioanl Association
Purchase Details
Closed on
Sep 19, 2008
Sold by
Rybinski David L and Will Of Adam R Rybinski
Bought by
Griffith Angela J and Griffith Randall M
Home Financials for this Owner
Home Financials are based on the most recent Mortgage that was taken out on this home.
Original Mortgage
$82,752
Interest Rate
6.57%
Mortgage Type
FHA
Purchase Details
Closed on
Aug 15, 2001
Sold by
Estate Of Marcelyn L Rybinski
Bought by
Rybinski Adam R
Purchase Details
Closed on
Nov 14, 1962
Bought by
Rybinski Adam R
Create a Home Valuation Report for This Property
The Home Valuation Report is an in-depth analysis detailing your home's value as well as a comparison with similar homes in the area
Home Values in the Area
Average Home Value in this Area
Purchase History
| Date | Buyer | Sale Price | Title Company |
|---|---|---|---|
| Almonte Dolly | $42,400 | None Available | |
| Us Bank Natioanl Association | $48,000 | None Available | |
| Griffith Angela J | $83,000 | Talon Group | |
| Rybinski Adam R | -- | -- | |
| Rybinski Adam R | -- | -- |
Source: Public Records
Mortgage History
| Date | Status | Borrower | Loan Amount |
|---|---|---|---|
| Previous Owner | Griffith Angela J | $82,752 |
Source: Public Records
Tax History Compared to Growth
Tax History
| Year | Tax Paid | Tax Assessment Tax Assessment Total Assessment is a certain percentage of the fair market value that is determined by local assessors to be the total taxable value of land and additions on the property. | Land | Improvement |
|---|---|---|---|---|
| 2024 | $2,737 | $57,790 | $14,250 | $43,540 |
| 2023 | $2,719 | $57,785 | $14,245 | $43,540 |
| 2022 | $2,036 | $28,430 | $8,230 | $20,200 |
| 2021 | $2,177 | $28,430 | $8,230 | $20,200 |
| 2020 | $1,549 | $28,430 | $8,230 | $20,200 |
| 2019 | $1,493 | $21,420 | $6,580 | $14,840 |
| 2018 | $1,637 | $21,420 | $6,580 | $14,840 |
| 2017 | $1,264 | $21,420 | $6,580 | $14,840 |
| 2016 | $1,609 | $21,600 | $5,670 | $15,930 |
| 2015 | $1,756 | $21,600 | $5,670 | $15,930 |
| 2014 | $1,423 | $21,600 | $5,670 | $15,930 |
| 2013 | $752 | $24,010 | $6,300 | $17,710 |
Source: Public Records
Map
Nearby Homes
- 4572 Saint Anthony Ln
- 4368 Broadhurst Dr
- 4489 Saint Margaret Ln
- 4148 Elbern Ave
- 451 Beaver Ave
- 91 Robinwood Ave
- 571 S Hamilton Rd
- 579 Westphal Ave
- 353 Shell Ct E
- 469 Cumberland Dr
- 424 Cumberland Dr
- 3814 Elbern Ave
- 4653 Kae Ave
- 4780 Etna Rd Unit 782
- 320 Collingwood Ave
- 322 Fairway Cir
- 4662 Jae Ave
- 91 Maplewood Ave
- 798 S Yearling Rd
- 547 Country Club Rd
- 115 Saint Christopher Ln
- 4383 Duchene Ln
- 121 Saint Christopher Ln
- 4411 Duchene Ln
- 100 S Yearling Rd
- 110 S Yearling Rd
- 129 Saint Christopher Ln
- 129 Saint Christopher Ln Unit L
- 118 Saint Christopher Ln
- 116 S Yearling Rd
- 4419 Duchene Ln
- 124 Saint Christopher Ln
- 124 St Christopher Ln Unit L
- 135 Saint Christopher Ln
- 135 Saint Christopher Ln Unit L
- 120 S Yearling Rd
- 130 Saint Christopher Ln
- 128 S Yearling Rd
- 4425 Duchene Ln
- 141 Saint Christopher Ln