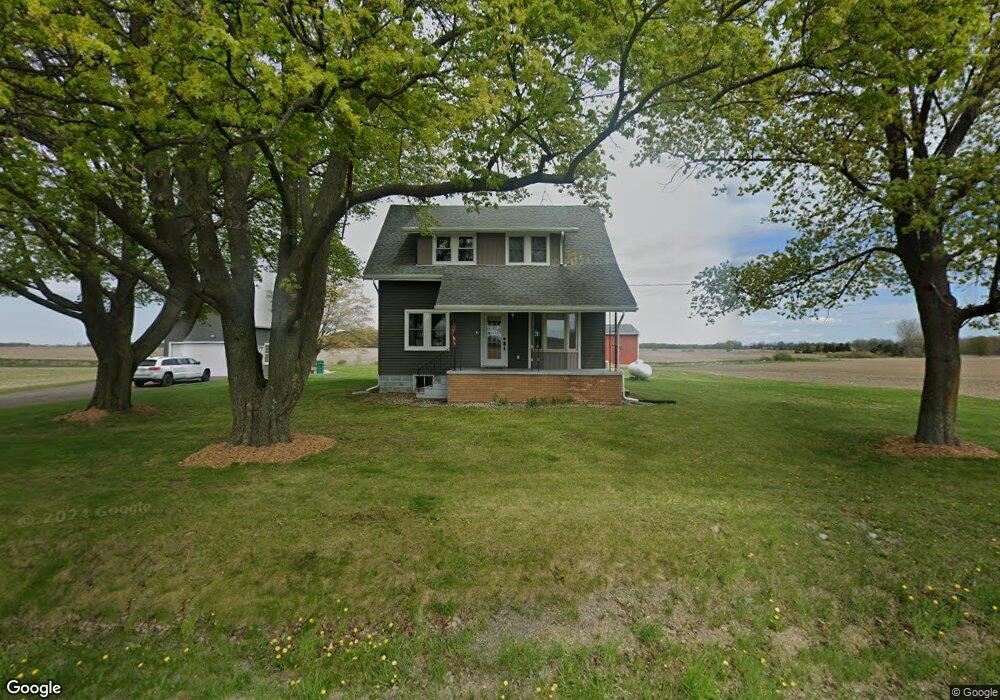
4387 Musgrove Hwy Sunfield, MI 48890
Estimated Value: $157,000 - $311,291
4
Beds
2
Baths
1,453
Sq Ft
$176/Sq Ft
Est. Value
About This Home
This home is located at 4387 Musgrove Hwy, Sunfield, MI 48890 and is currently estimated at $256,073, approximately $176 per square foot. 4387 Musgrove Hwy is a home located in Ionia County with nearby schools including Lakewood High School.
Ownership History
Date
Name
Owned For
Owner Type
Purchase Details
Closed on
Dec 4, 2020
Sold by
Lay Kyle P
Bought by
Cavanaugh Nathan R
Current Estimated Value
Home Financials for this Owner
Home Financials are based on the most recent Mortgage that was taken out on this home.
Original Mortgage
$171,700
Outstanding Balance
$153,137
Interest Rate
2.8%
Mortgage Type
Construction
Estimated Equity
$102,936
Purchase Details
Closed on
Jan 16, 2013
Sold by
Donovan Shaun
Bought by
Lay Kyle Patrick
Home Financials for this Owner
Home Financials are based on the most recent Mortgage that was taken out on this home.
Original Mortgage
$40,400
Interest Rate
3.31%
Mortgage Type
New Conventional
Purchase Details
Closed on
Oct 20, 2011
Sold by
Hewitt Robert and Hewitt Kelly
Bought by
Flagstar Bank
Purchase Details
Closed on
Jan 25, 2007
Sold by
Hewitt Robert L
Bought by
Hewitt Robert L and Hewitt Kelly
Home Financials for this Owner
Home Financials are based on the most recent Mortgage that was taken out on this home.
Original Mortgage
$123,250
Interest Rate
6.19%
Mortgage Type
New Conventional
Create a Home Valuation Report for This Property
The Home Valuation Report is an in-depth analysis detailing your home's value as well as a comparison with similar homes in the area
Home Values in the Area
Average Home Value in this Area
Purchase History
| Date | Buyer | Sale Price | Title Company |
|---|---|---|---|
| Cavanaugh Nathan R | $202,000 | -- | |
| Lay Kyle Patrick | $50,500 | None Available | |
| Flagstar Bank | $143,051 | -- | |
| Hewitt Robert L | -- | Nations Title |
Source: Public Records
Mortgage History
| Date | Status | Borrower | Loan Amount |
|---|---|---|---|
| Open | Cavanaugh Nathan R | $171,700 | |
| Previous Owner | Lay Kyle Patrick | $40,400 | |
| Previous Owner | Hewitt Robert L | $123,250 |
Source: Public Records
Tax History Compared to Growth
Tax History
| Year | Tax Paid | Tax Assessment Tax Assessment Total Assessment is a certain percentage of the fair market value that is determined by local assessors to be the total taxable value of land and additions on the property. | Land | Improvement |
|---|---|---|---|---|
| 2025 | $2,778 | $130,000 | $15,700 | $114,300 |
| 2024 | $1,127 | $130,000 | $15,700 | $114,300 |
| 2023 | $1,075 | $103,800 | $12,000 | $91,800 |
| 2022 | $1,023 | $103,800 | $12,000 | $91,800 |
| 2021 | $2,808 | $57,600 | $9,700 | $47,900 |
| 2020 | $426 | $57,600 | $9,700 | $47,900 |
| 2019 | $396 | $58,600 | $10,300 | $48,300 |
| 2018 | $1,133 | $49,400 | $17,100 | $32,300 |
| 2017 | $400 | $49,400 | $17,100 | $32,300 |
| 2016 | $396 | $40,100 | $11,700 | $28,400 |
| 2015 | -- | $40,100 | $11,700 | $28,400 |
| 2014 | $425 | $36,200 | $11,400 | $24,800 |
Source: Public Records
Map
Nearby Homes
- 13887 S Sunfield Rd
- 6113 E Musgrove Hwy
- 152 Washington St
- 475 Washington St
- 174 1st St
- 136 Jackson St
- 243 Jackson St
- 406 First St
- 0 E Emery Rd
- 67 W Grand Ledge Hwy
- 7161 E Eaton Hwy
- 13637 S State Rd
- 7730 W Saint Joseph Hwy
- 27 Charlotte St
- 2827 Green Acres Dr
- 161 Charlotte St
- 250 Meadowlane Dr
- 10141 Charlotte Hwy
- 382 Brittany Ln
- 234 W Grand Ledge Hwy Unit R1
- 4387 E Musgrove Hwy
- 0 Musgrove Unit 64188
- 0 E Musgrove Unit 75842
- 0 E Musgrove Unit 233272
- 4352 Musgrove Hwy
- 4501 Musgrove Hwy
- 4501 E Musgrove Hwy
- 4612 Musgrove Hwy
- 4693 Musgrove Hwy
- 13023 Sunfield Hwy
- 4631 Musgrove Hwy
- 4843 E Musgrove Hwy
- 4876 Musgrove Hwy
- 13417 Sunfield Hwy
- 13623 Sunfield Hwy
- 13418 Sunfield Hwy
- 12917 Petrie Rd
- 12757 Petrie Rd