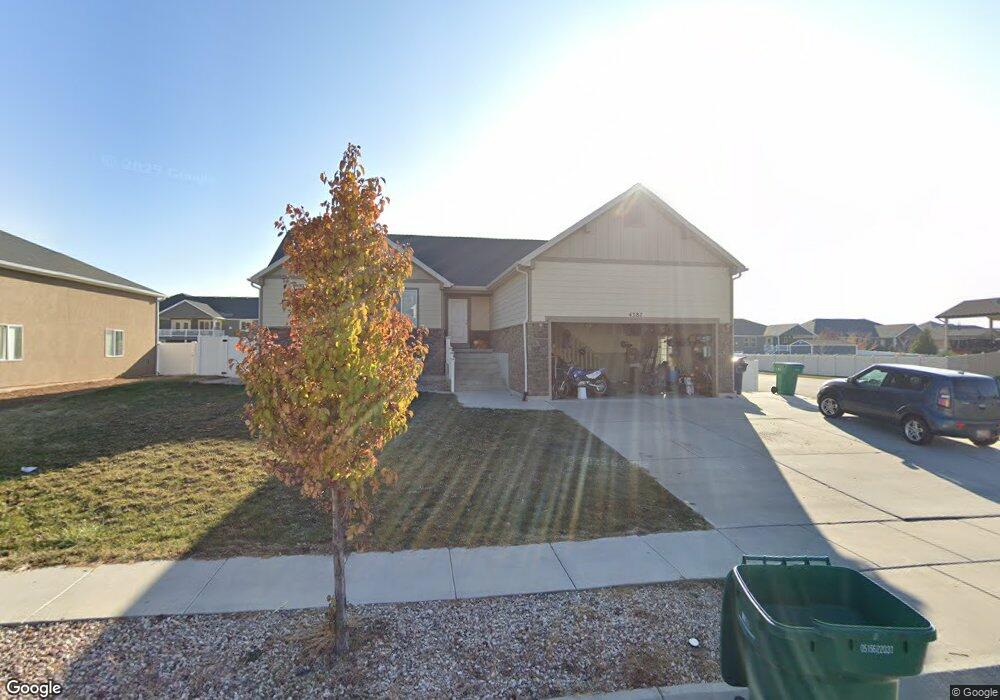
4387 W 5750 S Unit 7 Hooper, UT 84315
Estimated Value: $609,000 - $638,000
--
Bed
3
Baths
1,555
Sq Ft
$397/Sq Ft
Est. Value
About This Home
This home is located at 4387 W 5750 S Unit 7, Hooper, UT 84315 and is currently estimated at $617,037, approximately $396 per square foot. 4387 W 5750 S Unit 7 is a home located in Weber County with nearby schools including Freedom School, Roy Junior High School, and Roy High School.
Ownership History
Date
Name
Owned For
Owner Type
Purchase Details
Closed on
Oct 21, 2020
Sold by
Banner Cameron T
Bought by
Banner Cameron
Current Estimated Value
Home Financials for this Owner
Home Financials are based on the most recent Mortgage that was taken out on this home.
Original Mortgage
$329,895
Outstanding Balance
$292,889
Interest Rate
2.8%
Mortgage Type
New Conventional
Estimated Equity
$324,148
Purchase Details
Closed on
Jun 10, 2016
Sold by
Ji Ketty Tuo
Bought by
Banner Cameron T
Home Financials for this Owner
Home Financials are based on the most recent Mortgage that was taken out on this home.
Original Mortgage
$285,950
Interest Rate
3.66%
Mortgage Type
New Conventional
Purchase Details
Closed on
Sep 8, 2009
Sold by
Short Lance M
Bought by
Ji Tuo
Purchase Details
Closed on
Mar 21, 2008
Sold by
Hooper 22 Llc
Bought by
Short Lance M
Home Financials for this Owner
Home Financials are based on the most recent Mortgage that was taken out on this home.
Original Mortgage
$234,901
Interest Rate
5.72%
Mortgage Type
Construction
Create a Home Valuation Report for This Property
The Home Valuation Report is an in-depth analysis detailing your home's value as well as a comparison with similar homes in the area
Home Values in the Area
Average Home Value in this Area
Purchase History
| Date | Buyer | Sale Price | Title Company |
|---|---|---|---|
| Banner Cameron | -- | Accommodation | |
| Banner Cameron T | -- | First American Title | |
| Ji Tuo | -- | Bonneville Superior Title Co | |
| Short Lance M | -- | Bonneville Superior Title Co |
Source: Public Records
Mortgage History
| Date | Status | Borrower | Loan Amount |
|---|---|---|---|
| Open | Banner Cameron | $329,895 | |
| Closed | Banner Cameron T | $285,950 | |
| Previous Owner | Short Lance M | $234,901 |
Source: Public Records
Tax History Compared to Growth
Tax History
| Year | Tax Paid | Tax Assessment Tax Assessment Total Assessment is a certain percentage of the fair market value that is determined by local assessors to be the total taxable value of land and additions on the property. | Land | Improvement |
|---|---|---|---|---|
| 2025 | $3,532 | $565,005 | $221,484 | $343,521 |
| 2024 | $3,411 | $305,249 | $121,816 | $183,433 |
| 2023 | $3,431 | $305,250 | $122,039 | $183,211 |
| 2022 | $3,301 | $301,400 | $97,428 | $203,972 |
| 2021 | $2,854 | $437,000 | $112,263 | $324,737 |
| 2020 | $2,794 | $394,000 | $97,443 | $296,557 |
| 2019 | $2,691 | $358,000 | $68,356 | $289,644 |
| 2018 | $2,513 | $318,000 | $68,356 | $249,644 |
| 2017 | $2,340 | $285,000 | $58,804 | $226,196 |
| 2016 | $2,354 | $155,100 | $32,430 | $122,670 |
| 2015 | $2,384 | $175,925 | $32,430 | $143,495 |
| 2014 | $2,363 | $149,601 | $23,728 | $125,873 |
Source: Public Records
Map
Nearby Homes
- 4387 W 5750 S
- 4375 W 5750 S
- 4375 W 5750 S Unit 6
- 4401 W 5750 S
- 4401 W 5750 S Unit 8
- 4392 W 5775 S
- 4363 W 5750 S
- 4363 W 5750 S Unit 5
- 4370 W 5775 S
- 4388 W 5750 S Unit 23
- 4388 W 5750 S
- 4412 W 5775 S
- 4378 W 5750 S
- 4378 W 5750 S Unit 24
- 4415 W 5750 S
- 4415 W 5750 S Unit 9
- 4404 W 5750 S
- 4404 W 5750 S Unit 22
- 4358 W 5775 S
- 4345 W 5750 S