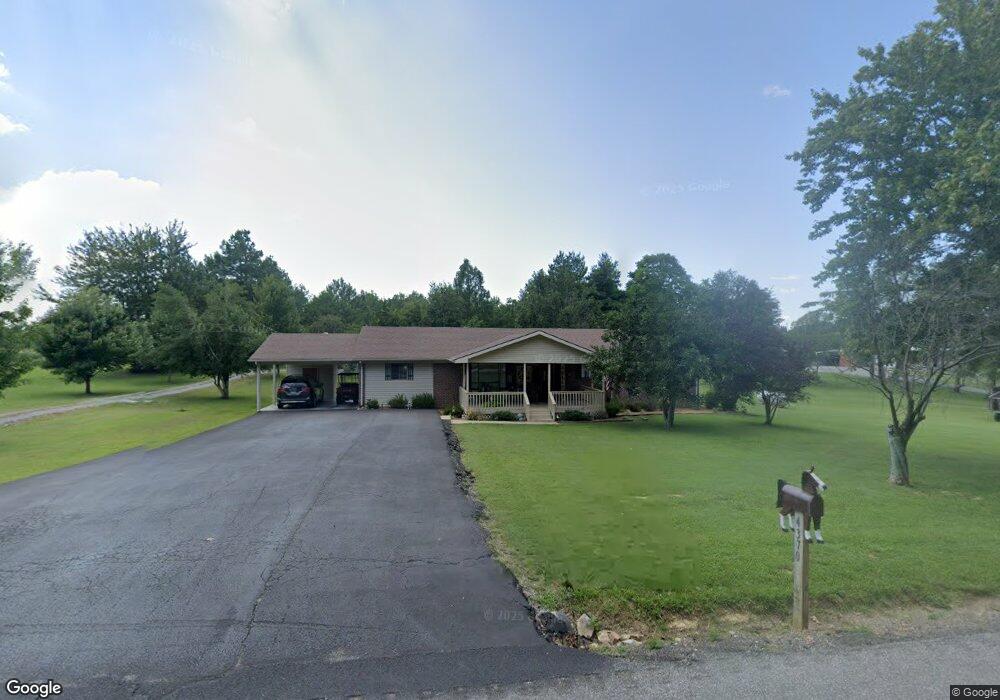
4388 Slickback Rd Benton, KY 42025
Estimated Value: $198,000 - $275,000
3
Beds
2
Baths
1,404
Sq Ft
$167/Sq Ft
Est. Value
About This Home
This home is located at 4388 Slickback Rd, Benton, KY 42025 and is currently estimated at $234,352, approximately $166 per square foot. 4388 Slickback Rd is a home located in Marshall County with nearby schools including South Marshall Elementary School and Marshall County High School.
Ownership History
Date
Name
Owned For
Owner Type
Purchase Details
Closed on
Oct 30, 2024
Sold by
Reynolds Warner and Reynolds Toni
Bought by
Reynolds Warner
Current Estimated Value
Home Financials for this Owner
Home Financials are based on the most recent Mortgage that was taken out on this home.
Original Mortgage
$188,237
Outstanding Balance
$186,363
Interest Rate
6.12%
Mortgage Type
New Conventional
Estimated Equity
$47,989
Purchase Details
Closed on
Mar 30, 2007
Sold by
Palmer William J and Lee Bobby Ann
Bought by
Reynolds Warner and Reynolds Tani
Home Financials for this Owner
Home Financials are based on the most recent Mortgage that was taken out on this home.
Original Mortgage
$133,000
Interest Rate
6.18%
Mortgage Type
New Conventional
Create a Home Valuation Report for This Property
The Home Valuation Report is an in-depth analysis detailing your home's value as well as a comparison with similar homes in the area
Home Values in the Area
Average Home Value in this Area
Purchase History
| Date | Buyer | Sale Price | Title Company |
|---|---|---|---|
| Reynolds Warner | -- | None Listed On Document | |
| Reynolds Warner | -- | None Listed On Document | |
| Reynolds Warner | $140,000 | None Available |
Source: Public Records
Mortgage History
| Date | Status | Borrower | Loan Amount |
|---|---|---|---|
| Open | Reynolds Warner | $188,237 | |
| Closed | Reynolds Warner | $188,237 | |
| Previous Owner | Reynolds Warner | $133,000 |
Source: Public Records
Tax History Compared to Growth
Tax History
| Year | Tax Paid | Tax Assessment Tax Assessment Total Assessment is a certain percentage of the fair market value that is determined by local assessors to be the total taxable value of land and additions on the property. | Land | Improvement |
|---|---|---|---|---|
| 2024 | $1,282 | $176,000 | $20,000 | $156,000 |
| 2023 | $1,010 | $145,000 | $16,000 | $129,000 |
| 2022 | $1,113 | $145,000 | $16,000 | $129,000 |
| 2021 | $1,125 | $145,000 | $16,000 | $129,000 |
| 2020 | $1,147 | $145,000 | $16,000 | $129,000 |
| 2019 | $1,147 | $145,000 | $16,000 | $129,000 |
| 2018 | $1,165 | $145,000 | $16,000 | $129,000 |
| 2017 | $1,166 | $145,000 | $16,000 | $129,000 |
| 2016 | $1,175 | $145,000 | $16,000 | $129,000 |
| 2015 | $1,127 | $140,000 | $15,000 | $125,000 |
| 2014 | $1,135 | $140,000 | $0 | $0 |
| 2010 | -- | $140,000 | $15,000 | $125,000 |
Source: Public Records
Map
Nearby Homes
- 1775 Wadesboro Rd S
- 49 Sid Darnall Rd
- 4754 Brewers Hwy
- 552 Toy York Rd
- 0 Penny Rd
- 116 Edwards Ln
- 1536 Brewers Hwy
- 18 Union Hill Rd
- 484 Union Hill Rd
- 7146 Kirksey Rd
- 0 Magness Rd
- 1.06 Acres on Slaughter Rd
- 453 Wadesboro Rd N
- 554 Merrywood Dr
- 522 Merrywood Dr
- 000 Bent Creek Dr
- 60 Cole Ln
- 111 Cherry Grove Dr
- 0 Lot 27 & Half of 28 Eagle Dr Unit 90269
- 0 Lot 29 & Half of 28 Eagle Dr Unit 90270
- 4473 Slickback Rd
- 4405 Slickback Rd
- 4449 Slickback Rd
- 4422 Slickback Rd
- 3001 Wadesboro Rd S
- 2935 Wadesboro Rd S
- 2988 Wadesboro Rd S
- 2954 Wadesboro Rd S
- 3050 Wadesboro Rd S
- 3052 Wadesboro Rd S
- 4503 Slickback Rd
- 4506 Slickback Rd
- 2819 Wadesboro Rd S
- 4370 Slickback Rd
- 4353 Slickback Rd
- 3185 Wadesboro Rd S
- 3100 Wadesboro Rd S
- 3245 Wadesboro Rd S
- 4591 Slickback Rd
- 4706 Slickback Rd