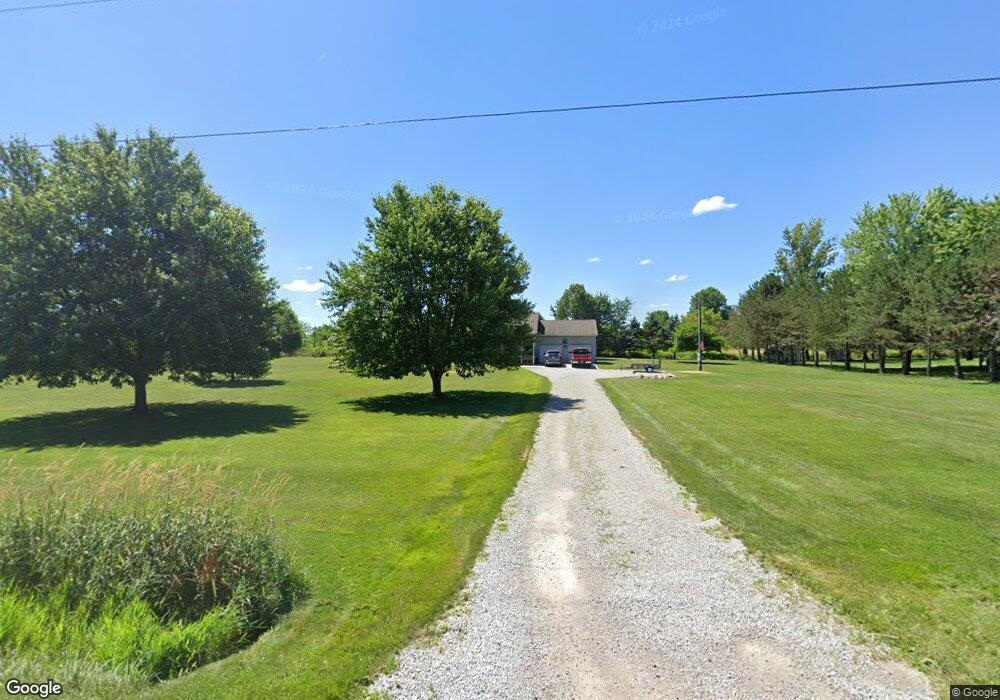
43889 Bursley Rd Wellington, OH 44090
Estimated Value: $279,000 - $299,770
4
Beds
3
Baths
1,196
Sq Ft
$243/Sq Ft
Est. Value
About This Home
This home is located at 43889 Bursley Rd, Wellington, OH 44090 and is currently estimated at $290,693, approximately $243 per square foot. 43889 Bursley Rd is a home located in Lorain County with nearby schools including Black River Education Center Elementary School, Black River Education Center Middle School, and Black River High School.
Ownership History
Date
Name
Owned For
Owner Type
Purchase Details
Closed on
Aug 28, 2003
Sold by
Mccourt Elizabeth D
Bought by
Eishen Larry L and Eishen Deborah J
Current Estimated Value
Home Financials for this Owner
Home Financials are based on the most recent Mortgage that was taken out on this home.
Original Mortgage
$131,950
Interest Rate
5.69%
Mortgage Type
FHA
Purchase Details
Closed on
Jan 17, 2001
Sold by
Holben Mark D and Holben Jodie D
Bought by
Mccourt Elizabeth D
Home Financials for this Owner
Home Financials are based on the most recent Mortgage that was taken out on this home.
Original Mortgage
$116,000
Interest Rate
7.58%
Purchase Details
Closed on
May 4, 1995
Sold by
Hawley Joel D
Bought by
Holben Mark D and Holben Jodie D
Home Financials for this Owner
Home Financials are based on the most recent Mortgage that was taken out on this home.
Original Mortgage
$113,900
Interest Rate
8.43%
Mortgage Type
New Conventional
Create a Home Valuation Report for This Property
The Home Valuation Report is an in-depth analysis detailing your home's value as well as a comparison with similar homes in the area
Home Values in the Area
Average Home Value in this Area
Purchase History
| Date | Buyer | Sale Price | Title Company |
|---|---|---|---|
| Eishen Larry L | $163,000 | -- | |
| Mccourt Elizabeth D | $145,000 | Midland | |
| Holben Mark D | $119,900 | -- |
Source: Public Records
Mortgage History
| Date | Status | Borrower | Loan Amount |
|---|---|---|---|
| Previous Owner | Eishen Larry L | $131,950 | |
| Previous Owner | Mccourt Elizabeth D | $116,000 | |
| Previous Owner | Holben Mark D | $113,900 |
Source: Public Records
Tax History Compared to Growth
Tax History
| Year | Tax Paid | Tax Assessment Tax Assessment Total Assessment is a certain percentage of the fair market value that is determined by local assessors to be the total taxable value of land and additions on the property. | Land | Improvement |
|---|---|---|---|---|
| 2024 | $2,643 | $71,316 | $15,575 | $55,741 |
| 2023 | $2,975 | $63,672 | $15,103 | $48,570 |
| 2022 | $2,980 | $63,672 | $15,103 | $48,570 |
| 2021 | $3,022 | $63,672 | $15,103 | $48,570 |
| 2020 | $2,728 | $53,920 | $12,790 | $41,130 |
| 2019 | $2,682 | $53,920 | $12,790 | $41,130 |
| 2018 | $2,721 | $53,920 | $12,790 | $41,130 |
| 2017 | $2,439 | $46,870 | $10,280 | $36,590 |
| 2016 | $2,461 | $46,870 | $10,280 | $36,590 |
| 2015 | $2,456 | $46,870 | $10,280 | $36,590 |
| 2014 | $2,292 | $44,060 | $9,660 | $34,400 |
| 2013 | $2,306 | $44,060 | $9,660 | $34,400 |
Source: Public Records
Map
Nearby Homes
- 13277 Bursley Rd
- 26479 Ohio 58
- 45426 Stewart Rd
- 25600 Mcmillan Rd
- 229 N Main St
- 208 Jones Rd
- 201 Stuart Dr
- 238 Reserve Cir
- 217 Liberty St
- 12793 New London Eastern Rd
- 43983 State Route 18
- 508 Courtland St
- 125 Pleasant St
- 40580 Smith Rd
- 44544 Stewart Rd
- 207 Grand Ave
- 124 Wheeling Ave
- 377 County Road 40
- 46748 New London Eastern Rd
- 120 Hale St
- 43891 Bursley Rd
- 43887 Bursley Rd
- 43876 Bursley Rd
- 43877 Bursley Rd
- 43805 Bursley Rd
- 26225 West Rd
- 26039 West Rd
- 25763 West Rd
- 43759 Bursley Rd
- 43710 Bursley Rd
- 44181 Bursley Rd
- 25757 West Rd
- 26191 West Rd
- 26265 West Rd
- 26240 West Rd
- 44305 Bursley Rd
- 26278 West Rd
- 26391 West Rd
- 0 Bursley Rd
- 0 Bursley Rd