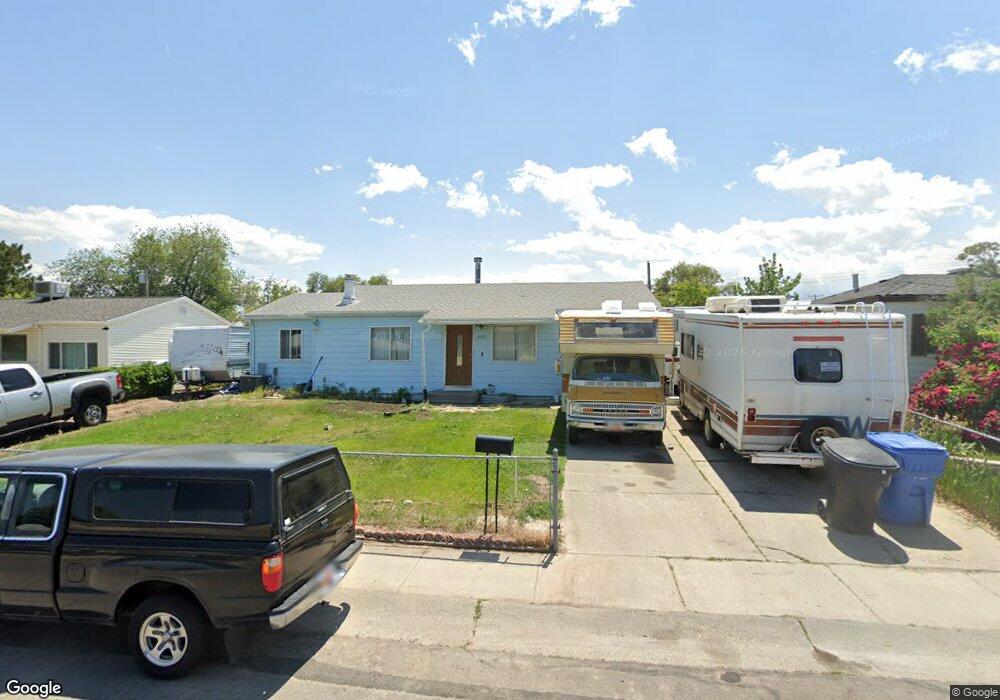
4389 W 5135 S Salt Lake City, UT 84118
Estimated Value: $372,000 - $415,966
3
Beds
2
Baths
1,688
Sq Ft
$233/Sq Ft
Est. Value
About This Home
This home is located at 4389 W 5135 S, Salt Lake City, UT 84118 and is currently estimated at $393,242, approximately $232 per square foot. 4389 W 5135 S is a home located in Salt Lake County with nearby schools including David Gourley Elementary School, Kearns Jr High School, and Kearns High School.
Ownership History
Date
Name
Owned For
Owner Type
Purchase Details
Closed on
Nov 3, 2017
Sold by
White Robbyn Burgener
Bought by
Holmes Jeremy Lee and Holmes Aleena Joy
Current Estimated Value
Home Financials for this Owner
Home Financials are based on the most recent Mortgage that was taken out on this home.
Original Mortgage
$213,624
Outstanding Balance
$178,912
Interest Rate
3.83%
Mortgage Type
FHA
Estimated Equity
$214,330
Purchase Details
Closed on
Nov 18, 1998
Sold by
Burgener Shirley F
Bought by
Burgener Shirley F and Shirley F Burgener Family Trust
Create a Home Valuation Report for This Property
The Home Valuation Report is an in-depth analysis detailing your home's value as well as a comparison with similar homes in the area
Home Values in the Area
Average Home Value in this Area
Purchase History
| Date | Buyer | Sale Price | Title Company |
|---|---|---|---|
| Holmes Jeremy Lee | -- | First American Title | |
| Burgener Shirley F | -- | -- |
Source: Public Records
Mortgage History
| Date | Status | Borrower | Loan Amount |
|---|---|---|---|
| Open | Holmes Jeremy Lee | $213,624 |
Source: Public Records
Tax History Compared to Growth
Tax History
| Year | Tax Paid | Tax Assessment Tax Assessment Total Assessment is a certain percentage of the fair market value that is determined by local assessors to be the total taxable value of land and additions on the property. | Land | Improvement |
|---|---|---|---|---|
| 2025 | $2,669 | $377,300 | $88,200 | $289,100 |
| 2024 | $2,669 | $359,400 | $82,800 | $276,600 |
| 2023 | $2,669 | $320,000 | $79,600 | $240,400 |
| 2022 | $2,722 | $334,100 | $78,100 | $256,000 |
| 2021 | $2,536 | $277,200 | $60,100 | $217,100 |
| 2020 | $2,158 | $236,200 | $54,700 | $181,500 |
| 2019 | $2,089 | $232,200 | $51,600 | $180,600 |
| 2018 | $1,988 | $213,300 | $51,600 | $161,700 |
| 2017 | $1,535 | $172,400 | $51,600 | $120,800 |
| 2016 | $1,299 | $146,100 | $47,600 | $98,500 |
| 2015 | $1,251 | $131,000 | $58,000 | $73,000 |
| 2014 | $1,172 | $120,100 | $53,900 | $66,200 |
Source: Public Records
Map
Nearby Homes