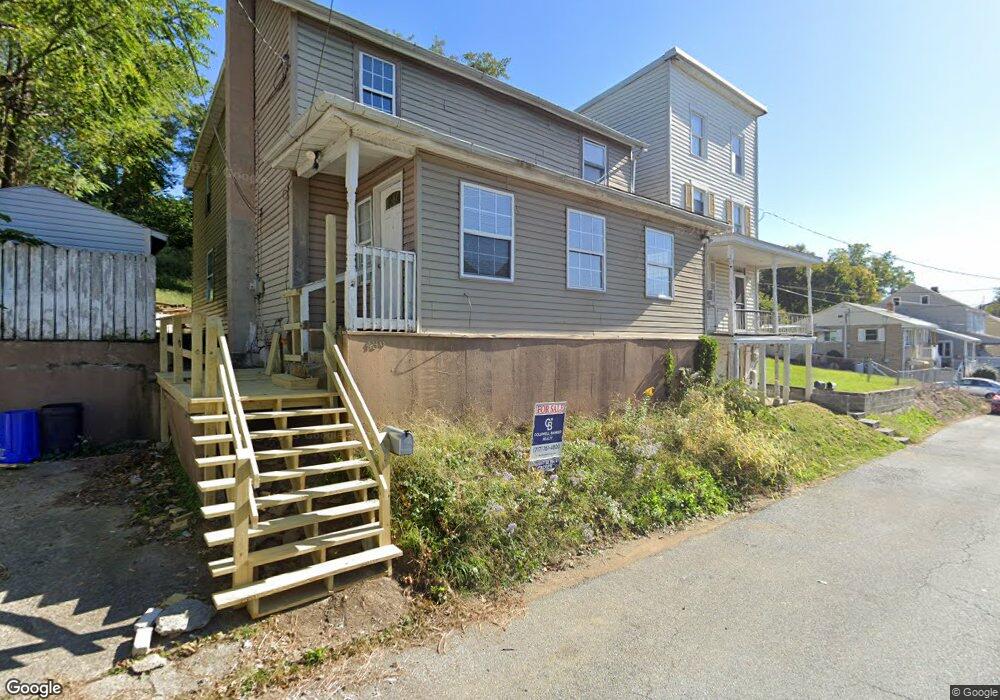
439 2nd St Enola, PA 17025
East Pennsboro NeighborhoodEstimated Value: $145,000 - $241,000
5
Beds
3
Baths
1,920
Sq Ft
$102/Sq Ft
Est. Value
About This Home
This home is located at 439 2nd St, Enola, PA 17025 and is currently estimated at $195,674, approximately $101 per square foot. 439 2nd St is a home located in Cumberland County with nearby schools including East Pennsboro Area Middle School, East Pennsboro Area Senior High School, and Harrisburg Academy.
Ownership History
Date
Name
Owned For
Owner Type
Purchase Details
Closed on
Apr 12, 2018
Sold by
Chinniah Gnana and Chinniah Suganthini
Bought by
Schaffstall James L
Current Estimated Value
Home Financials for this Owner
Home Financials are based on the most recent Mortgage that was taken out on this home.
Original Mortgage
$95,243
Outstanding Balance
$82,021
Interest Rate
4.5%
Mortgage Type
FHA
Estimated Equity
$113,653
Purchase Details
Closed on
Dec 30, 2004
Sold by
Gilmore Patrick T
Bought by
Chinniah Gnana
Create a Home Valuation Report for This Property
The Home Valuation Report is an in-depth analysis detailing your home's value as well as a comparison with similar homes in the area
Home Values in the Area
Average Home Value in this Area
Purchase History
| Date | Buyer | Sale Price | Title Company |
|---|---|---|---|
| Schaffstall James L | $97,000 | None Available | |
| Chinniah Gnana | $48,000 | -- |
Source: Public Records
Mortgage History
| Date | Status | Borrower | Loan Amount |
|---|---|---|---|
| Open | Schaffstall James L | $95,243 |
Source: Public Records
Tax History Compared to Growth
Tax History
| Year | Tax Paid | Tax Assessment Tax Assessment Total Assessment is a certain percentage of the fair market value that is determined by local assessors to be the total taxable value of land and additions on the property. | Land | Improvement |
|---|---|---|---|---|
| 2025 | $2,731 | $132,300 | $28,300 | $104,000 |
| 2024 | $2,576 | $132,300 | $28,300 | $104,000 |
| 2023 | $2,430 | $132,300 | $28,300 | $104,000 |
| 2022 | $2,285 | $132,300 | $28,300 | $104,000 |
| 2021 | $2,246 | $132,300 | $28,300 | $104,000 |
| 2020 | $16,933 | $132,300 | $28,300 | $104,000 |
| 2019 | $2,167 | $132,300 | $28,300 | $104,000 |
| 2018 | $2,143 | $132,300 | $28,300 | $104,000 |
| 2017 | -- | $132,300 | $28,300 | $104,000 |
| 2016 | -- | $132,300 | $28,300 | $104,000 |
| 2015 | -- | $132,300 | $28,300 | $104,000 |
| 2014 | -- | $132,300 | $28,300 | $104,000 |
Source: Public Records
Map
Nearby Homes