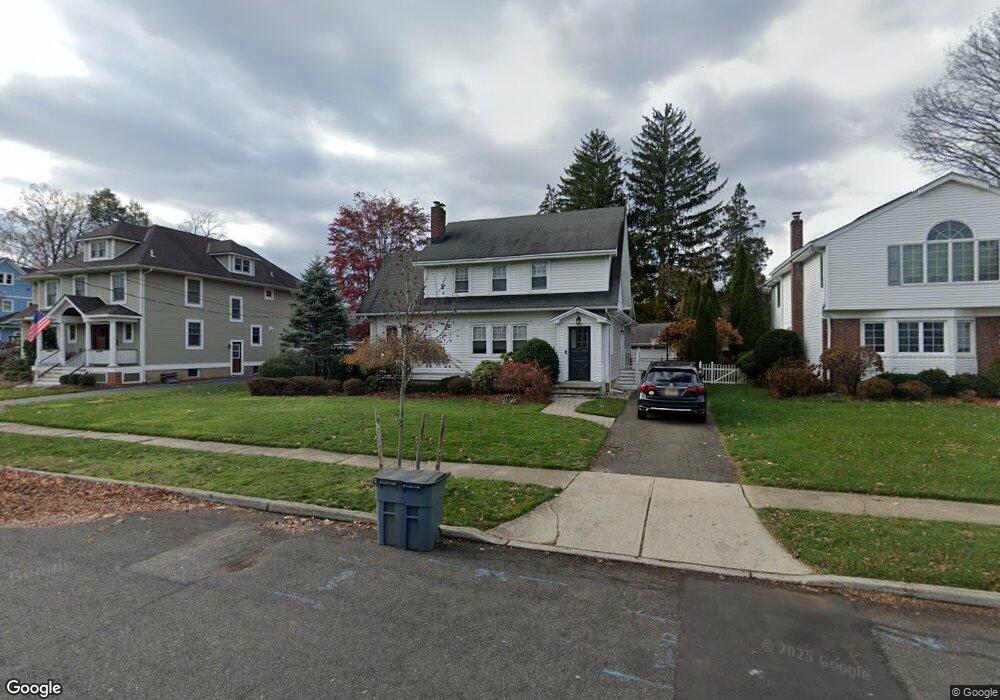
439 3rd St Oradell, NJ 07649
Estimated Value: $1,011,000 - $1,156,000
Studio
--
Bath
2,738
Sq Ft
$396/Sq Ft
Est. Value
About This Home
This home is located at 439 3rd St, Oradell, NJ 07649 and is currently estimated at $1,083,512, approximately $395 per square foot. 439 3rd St is a home located in Bergen County with nearby schools including Oradell Elementary School, River Dell Middle School, and River Dell Regional High School.
Ownership History
Date
Name
Owned For
Owner Type
Purchase Details
Closed on
Jul 15, 2005
Sold by
Trecker James
Bought by
Bossbaly Richard and Bossbaly Daniela
Current Estimated Value
Home Financials for this Owner
Home Financials are based on the most recent Mortgage that was taken out on this home.
Original Mortgage
$459,000
Interest Rate
6.23%
Create a Home Valuation Report for This Property
The Home Valuation Report is an in-depth analysis detailing your home's value as well as a comparison with similar homes in the area
Home Values in the Area
Average Home Value in this Area
Purchase History
| Date | Buyer | Sale Price | Title Company |
|---|---|---|---|
| Bossbaly Richard | $655,000 | -- |
Source: Public Records
Mortgage History
| Date | Status | Borrower | Loan Amount |
|---|---|---|---|
| Previous Owner | Bossbaly Richard | $459,000 |
Source: Public Records
Tax History
| Year | Tax Paid | Tax Assessment Tax Assessment Total Assessment is a certain percentage of the fair market value that is determined by local assessors to be the total taxable value of land and additions on the property. | Land | Improvement |
|---|---|---|---|---|
| 2025 | $19,890 | $817,500 | $375,000 | $442,500 |
| 2024 | $19,407 | $730,700 | $337,600 | $393,100 |
| 2023 | $18,443 | $727,400 | $336,300 | $391,100 |
| 2022 | $18,443 | $639,700 | $318,800 | $320,900 |
| 2021 | $17,070 | $610,500 | $303,100 | $307,400 |
| 2020 | $16,744 | $606,000 | $300,600 | $305,400 |
| 2019 | $16,596 | $595,700 | $296,100 | $299,600 |
| 2018 | $16,289 | $593,400 | $297,600 | $295,800 |
| 2017 | $15,755 | $583,100 | $293,100 | $290,000 |
| 2016 | $14,928 | $501,600 | $267,500 | $234,100 |
| 2015 | $14,602 | $501,600 | $267,500 | $234,100 |
| 2014 | $13,965 | $501,600 | $267,500 | $234,100 |
Source: Public Records
Map
Nearby Homes