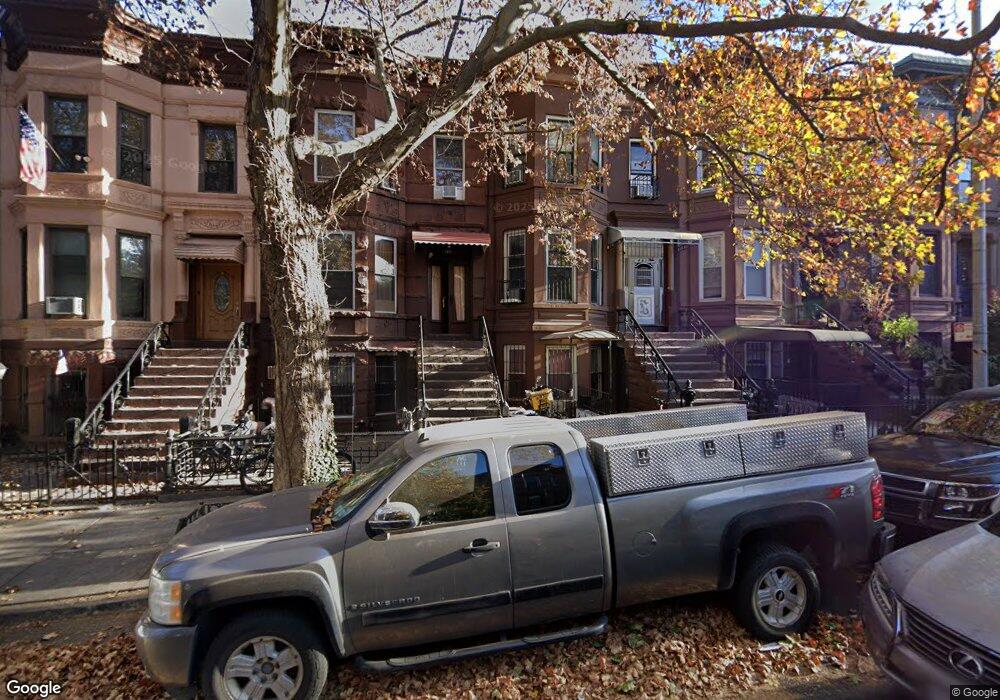
439 55th St Unit Building Brooklyn, NY 11220
Sunset Park NeighborhoodEstimated Value: $1,220,563 - $1,603,000
--
Bed
--
Bath
2,280
Sq Ft
$631/Sq Ft
Est. Value
About This Home
This home is located at 439 55th St Unit Building, Brooklyn, NY 11220 and is currently estimated at $1,438,141, approximately $630 per square foot. 439 55th St Unit Building is a home located in Kings County with nearby schools including P.S. 503: The School of Discovery, IS 220 John J. Pershing, and Fort Hamilton High School.
Ownership History
Date
Name
Owned For
Owner Type
Purchase Details
Closed on
Apr 3, 2019
Sold by
Elizabeth Jane Carew As Co-Administrato and Estate Of James Gregory Ronan
Bought by
439Chen Inc
Current Estimated Value
Home Financials for this Owner
Home Financials are based on the most recent Mortgage that was taken out on this home.
Original Mortgage
$740,000
Outstanding Balance
$650,592
Interest Rate
4.3%
Mortgage Type
Purchase Money Mortgage
Estimated Equity
$787,549
Purchase Details
Closed on
Jun 1, 2000
Sold by
Ronan James G and Carew Elizabeth Ronan
Bought by
Ronan James G
Purchase Details
Closed on
Mar 1, 1997
Sold by
Ronan James G and Carew Elizabeth Ronan
Bought by
Ronan James G and Carew Elizabeth Ronan
Purchase Details
Closed on
Sep 20, 1994
Sold by
Ronan Marcella and Ronan James G
Bought by
Ronan James G and Carew Elizabeth Ronan
Create a Home Valuation Report for This Property
The Home Valuation Report is an in-depth analysis detailing your home's value as well as a comparison with similar homes in the area
Home Values in the Area
Average Home Value in this Area
Purchase History
| Date | Buyer | Sale Price | Title Company |
|---|---|---|---|
| 439Chen Inc | $1,250,000 | -- | |
| 439Chen Inc | $1,250,000 | -- | |
| Ronan James G | $165,000 | Regal Title Agency | |
| Ronan James G | -- | Regal Title Agency | |
| Ronan James G | $250,000 | Commonwealth Land Title Ins | |
| Ronan James G | -- | Commonwealth Land Title Ins | |
| Ronan James G | -- | -- | |
| Ronan James G | -- | -- |
Source: Public Records
Mortgage History
| Date | Status | Borrower | Loan Amount |
|---|---|---|---|
| Open | 439Chen Inc | $740,000 | |
| Closed | 439Chen Inc | $740,000 |
Source: Public Records
Tax History Compared to Growth
Tax History
| Year | Tax Paid | Tax Assessment Tax Assessment Total Assessment is a certain percentage of the fair market value that is determined by local assessors to be the total taxable value of land and additions on the property. | Land | Improvement |
|---|---|---|---|---|
| 2025 | $8,735 | $71,940 | $16,380 | $55,560 |
| 2024 | $8,735 | $71,040 | $16,380 | $54,660 |
| 2023 | $8,832 | $80,220 | $16,380 | $63,840 |
| 2022 | $8,627 | $68,400 | $16,380 | $52,020 |
| 2021 | $8,671 | $75,000 | $16,380 | $58,620 |
| 2020 | $6,503 | $66,720 | $16,380 | $50,340 |
| 2019 | $6,246 | $62,760 | $16,380 | $46,380 |
| 2018 | $6,087 | $29,859 | $8,192 | $21,667 |
| 2017 | $6,040 | $29,631 | $7,428 | $22,203 |
| 2016 | $5,588 | $27,955 | $8,059 | $19,896 |
| 2015 | $3,152 | $26,374 | $9,312 | $17,062 |
| 2014 | $3,152 | $24,883 | $10,538 | $14,345 |
Source: Public Records
Map
Nearby Homes
- 435 55th St
- 5411 4th Ave
- 464 53rd St
- 423 56th St
- 5505 4th Ave
- 368 54th St
- 462 52nd St Unit 2D
- 447 E 57th St Unit 14F
- 447 E 57th St Unit 3/4A
- 5222 4th Ave
- 524 54th St
- 516 55th St
- 413 57th St
- 353 54th St
- 519 53rd St
- 355 53rd St Unit 1B
- 355 53rd St Unit 4B
- 355 53rd St Unit 3B
- 538 54th St
- 342 53rd St Unit 3-F