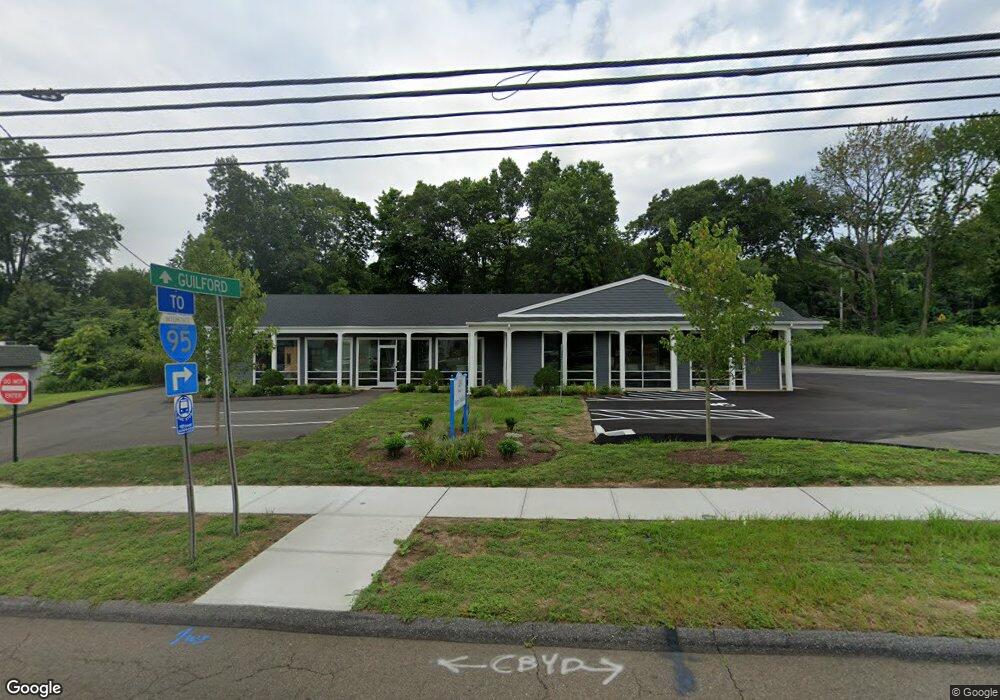
439 Boston Post Rd Guilford, CT 06437
Estimated Value: $1,350,156
3
Beds
2
Baths
4,100
Sq Ft
$329/Sq Ft
Est. Value
About This Home
This home is located at 439 Boston Post Rd, Guilford, CT 06437 and is currently estimated at $1,350,156, approximately $329 per square foot. 439 Boston Post Rd is a home located in New Haven County with nearby schools including E.C. Adams Middle School, A. Baldwin Middle School, and Guilford High School.
Ownership History
Date
Name
Owned For
Owner Type
Purchase Details
Closed on
Jul 25, 2023
Sold by
Mgm Holdings Llc
Bought by
Apt Foundation Inc
Current Estimated Value
Purchase Details
Closed on
May 27, 2020
Sold by
439 Bpr Llc
Bought by
Mgm Holdings Llc
Home Financials for this Owner
Home Financials are based on the most recent Mortgage that was taken out on this home.
Original Mortgage
$686,280
Interest Rate
3.3%
Mortgage Type
Stand Alone Refi Refinance Of Original Loan
Purchase Details
Closed on
Nov 30, 2006
Sold by
Peterson Bruce S
Bought by
439 Bpr Llc
Purchase Details
Closed on
Feb 7, 1989
Sold by
Tagatac Mary A
Bought by
Peterson Bruce S
Create a Home Valuation Report for This Property
The Home Valuation Report is an in-depth analysis detailing your home's value as well as a comparison with similar homes in the area
Home Values in the Area
Average Home Value in this Area
Purchase History
| Date | Buyer | Sale Price | Title Company |
|---|---|---|---|
| Apt Foundation Inc | $1,200,000 | None Available | |
| Apt Foundation Inc | $1,200,000 | None Available | |
| Mgm Holdings Llc | $817,500 | None Available | |
| Mgm Holdings Llc | $817,500 | None Available | |
| 439 Bpr Llc | $750,000 | -- | |
| 439 Bpr Llc | $750,000 | -- | |
| Peterson Bruce S | $625,000 | -- |
Source: Public Records
Mortgage History
| Date | Status | Borrower | Loan Amount |
|---|---|---|---|
| Previous Owner | Mgm Holdings Llc | $686,280 | |
| Previous Owner | Peterson Bruce S | $780,000 | |
| Previous Owner | Peterson Bruce S | $500,000 | |
| Previous Owner | Peterson Bruce S | $48,500 |
Source: Public Records
Tax History Compared to Growth
Tax History
| Year | Tax Paid | Tax Assessment Tax Assessment Total Assessment is a certain percentage of the fair market value that is determined by local assessors to be the total taxable value of land and additions on the property. | Land | Improvement |
|---|---|---|---|---|
| 2024 | $16,669 | $627,130 | $189,000 | $438,130 |
| 2023 | $16,230 | $627,130 | $189,000 | $438,130 |
| 2022 | $18,608 | $559,650 | $175,000 | $384,650 |
| 2021 | $18,256 | $559,650 | $175,000 | $384,650 |
| 2020 | $18,082 | $559,650 | $175,000 | $384,650 |
| 2019 | $17,926 | $559,650 | $175,000 | $384,650 |
| 2018 | $17,506 | $559,650 | $175,000 | $384,650 |
| 2017 | $15,610 | $531,670 | $175,000 | $356,670 |
| 2016 | $15,243 | $531,670 | $175,000 | $356,670 |
| 2015 | $15,014 | $531,670 | $175,000 | $356,670 |
| 2014 | $14,578 | $531,670 | $175,000 | $356,670 |
Source: Public Records
Map
Nearby Homes
- 46 Sperry Dr
- 195 Tanner Marsh Rd
- 324 Tanner Marsh Rd
- 360 E River Rd
- 8 Horseshoe Rd
- 42 Horseshoe Rd
- 412 Tanner Marsh Rd
- 51 Pearl St
- 12 Paddock Ln
- 18 Village Cir Unit 18
- 16 Village Cir Unit 16
- 14 Village Cir Unit 14
- 7 Village Cir Unit 7
- 599 Goose Ln
- 28 Village Cir Unit 28
- 174 Whitfield St
- 67 Boston Post Rd Unit 8
- 1054 Boston Post Rd
- 505 Old Whitfield St
- 379 Whitfield St Unit BS1438
- 450 Boston Post Rd
- 415 Boston Post Rd
- 465 Boston St
- 47 Clapboard Hill Rd Unit 1
- 47 Clapboard Hill Rd Unit 6B
- 47 Clapboard Hill Rd Unit 6A
- 47 Clapboard Hill Rd Unit 7
- 47 Clapboard Hill Rd Unit 5A
- 47 Clapboard Hill Rd Unit 8
- 47 Clapboard Hill Rd
- 485 Boston St
- 51 Clapboard Hill Rd
- 493 Boston St
- 18 Soundview Rd
- 29 Soundview Rd Unit 11A
- 29 Soundview Rd Unit 6
- 29 Soundview Rd Unit 1A
- 29 Soundview Rd
- 29 Soundview Rd Unit 1
- 509 Boston St