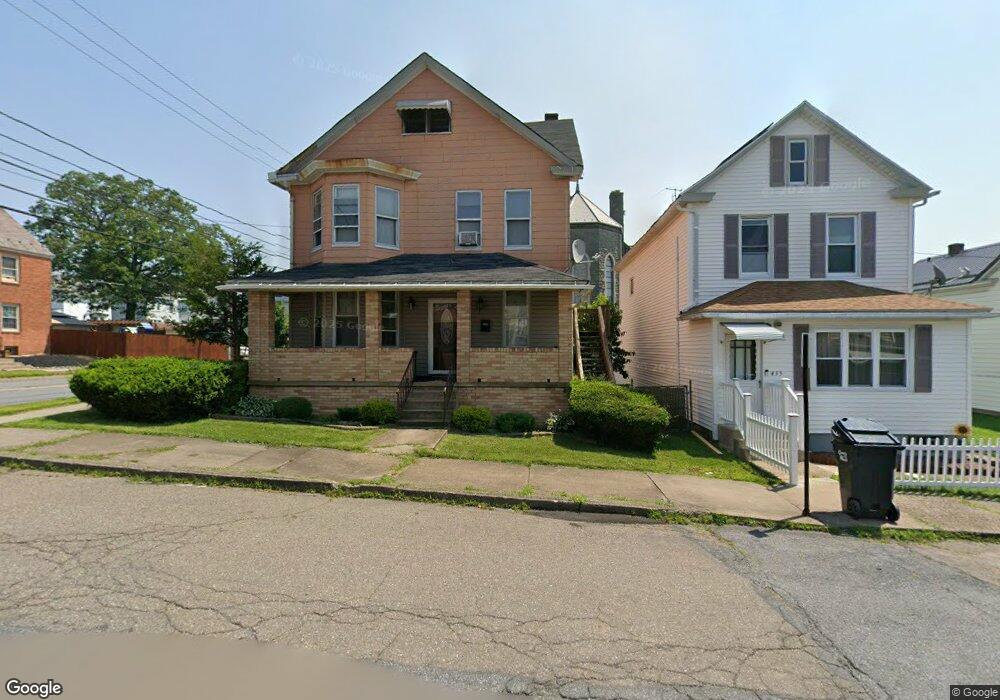
439 Cedar St Freeland, PA 18224
Estimated Value: $156,095 - $207,000
--
Bed
--
Bath
2,286
Sq Ft
$81/Sq Ft
Est. Value
About This Home
This home is located at 439 Cedar St, Freeland, PA 18224 and is currently estimated at $184,774, approximately $80 per square foot. 439 Cedar St is a home located in Luzerne County with nearby schools including Hazleton Area High School and Mmi Preparatory School.
Ownership History
Date
Name
Owned For
Owner Type
Purchase Details
Closed on
Jan 18, 2016
Sold by
Land Tycoon Inc
Bought by
Rodriguez Cesarina
Current Estimated Value
Purchase Details
Closed on
Sep 20, 2012
Sold by
Oshokhai Abdulahi
Bought by
Land Tycoon Inc
Purchase Details
Closed on
Nov 27, 2009
Sold by
Lmp Investments Inc
Bought by
Oshokhai Abdulahi
Purchase Details
Closed on
Feb 1, 2007
Sold by
Karpowich Jason A
Bought by
Beasley Rachel S
Create a Home Valuation Report for This Property
The Home Valuation Report is an in-depth analysis detailing your home's value as well as a comparison with similar homes in the area
Home Values in the Area
Average Home Value in this Area
Purchase History
| Date | Buyer | Sale Price | Title Company |
|---|---|---|---|
| Rodriguez Cesarina | $30,000 | None Available | |
| Land Tycoon Inc | $4,682 | None Available | |
| Oshokhai Abdulahi | $50,000 | None Available | |
| Lmp Investments Inc | $40,000 | None Available | |
| Beasley Rachel S | $122,500 | None Available |
Source: Public Records
Tax History Compared to Growth
Tax History
| Year | Tax Paid | Tax Assessment Tax Assessment Total Assessment is a certain percentage of the fair market value that is determined by local assessors to be the total taxable value of land and additions on the property. | Land | Improvement |
|---|---|---|---|---|
| 2025 | $1,709 | $83,000 | $22,500 | $60,500 |
| 2024 | $1,640 | $83,000 | $22,500 | $60,500 |
| 2023 | $1,608 | $83,000 | $22,500 | $60,500 |
| 2022 | $1,593 | $83,000 | $22,500 | $60,500 |
| 2021 | $1,545 | $83,000 | $22,500 | $60,500 |
| 2020 | $1,485 | $83,000 | $22,500 | $60,500 |
| 2019 | $1,422 | $83,000 | $22,500 | $60,500 |
| 2018 | $1,368 | $83,000 | $22,500 | $60,500 |
| 2017 | $1,338 | $83,000 | $22,500 | $60,500 |
| 2016 | -- | $83,000 | $22,500 | $60,500 |
| 2015 | $1,230 | $83,000 | $22,500 | $60,500 |
| 2014 | $1,230 | $83,000 | $22,500 | $60,500 |
Source: Public Records
Map
Nearby Homes