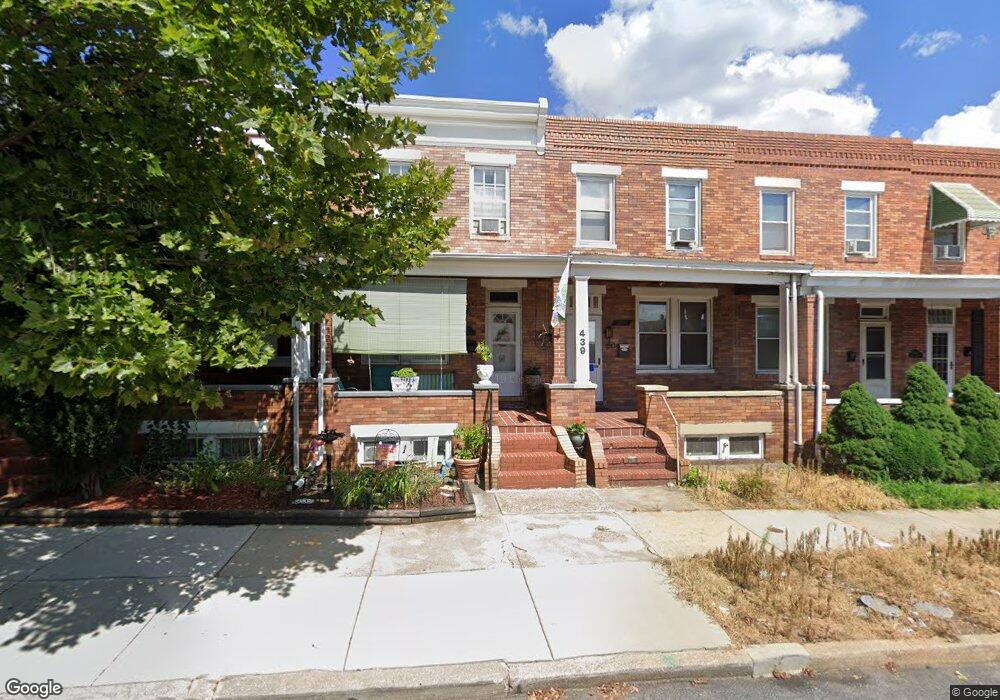
439 Drew St Baltimore, MD 21224
Bayview NeighborhoodEstimated Value: $119,000 - $148,838
3
Beds
1
Bath
--
Sq Ft
1,481
Sq Ft Lot
About This Home
This home is located at 439 Drew St, Baltimore, MD 21224 and is currently estimated at $133,919. 439 Drew St is a home located in Baltimore City with nearby schools including John Ruhrah Elementary School, Booker T. Washington Middle School, and Patterson High School.
Ownership History
Date
Name
Owned For
Owner Type
Purchase Details
Closed on
Jan 22, 2007
Sold by
Mckissick Traci
Bought by
Mckissick Trish R
Current Estimated Value
Home Financials for this Owner
Home Financials are based on the most recent Mortgage that was taken out on this home.
Original Mortgage
$132,000
Outstanding Balance
$79,496
Interest Rate
6.35%
Mortgage Type
Purchase Money Mortgage
Estimated Equity
$54,423
Purchase Details
Closed on
Jan 21, 2005
Sold by
Tsampos John
Bought by
Mckissick Traci and Salak Abigail J
Purchase Details
Closed on
Nov 18, 2004
Sold by
Tsampos John
Bought by
Mckissick Traci and Salak Abigail J
Purchase Details
Closed on
Jul 1, 2002
Sold by
Tsampos Mike
Bought by
Tsampos John
Purchase Details
Closed on
Jun 9, 2000
Sold by
Isampos Mike
Bought by
Tsampos Mike and Tsampos John
Purchase Details
Closed on
Feb 28, 1995
Sold by
Ference Leon J
Bought by
Tsampos Mike
Create a Home Valuation Report for This Property
The Home Valuation Report is an in-depth analysis detailing your home's value as well as a comparison with similar homes in the area
Home Values in the Area
Average Home Value in this Area
Purchase History
| Date | Buyer | Sale Price | Title Company |
|---|---|---|---|
| Mckissick Trish R | $165,000 | -- | |
| Mckissick Traci | $55,625 | -- | |
| Mckissick Traci | $110,000 | -- | |
| Mckissick Traci | $110,000 | -- | |
| Tsampos John | $25,446 | -- | |
| Tsampos Mike | -- | -- | |
| Tsampos Mike | $40,000 | -- |
Source: Public Records
Mortgage History
| Date | Status | Borrower | Loan Amount |
|---|---|---|---|
| Open | Mckissick Traci | $132,000 | |
| Closed | Mckissick Trish R | $132,000 |
Source: Public Records
Tax History Compared to Growth
Tax History
| Year | Tax Paid | Tax Assessment Tax Assessment Total Assessment is a certain percentage of the fair market value that is determined by local assessors to be the total taxable value of land and additions on the property. | Land | Improvement |
|---|---|---|---|---|
| 2025 | $2,353 | $108,700 | $25,000 | $83,700 |
| 2024 | $2,353 | $100,200 | $0 | $0 |
| 2023 | $2,154 | $91,700 | $0 | $0 |
| 2022 | $1,964 | $83,200 | $25,000 | $58,200 |
| 2021 | $1,964 | $83,200 | $25,000 | $58,200 |
| 2020 | $1,964 | $83,200 | $25,000 | $58,200 |
| 2019 | $2,008 | $85,500 | $25,000 | $60,500 |
| 2018 | $2,005 | $84,967 | $0 | $0 |
| 2017 | $1,993 | $84,433 | $0 | $0 |
| 2016 | $2,781 | $83,900 | $0 | $0 |
| 2015 | $2,781 | $83,900 | $0 | $0 |
| 2014 | $2,781 | $83,900 | $0 | $0 |
Source: Public Records
Map
Nearby Homes