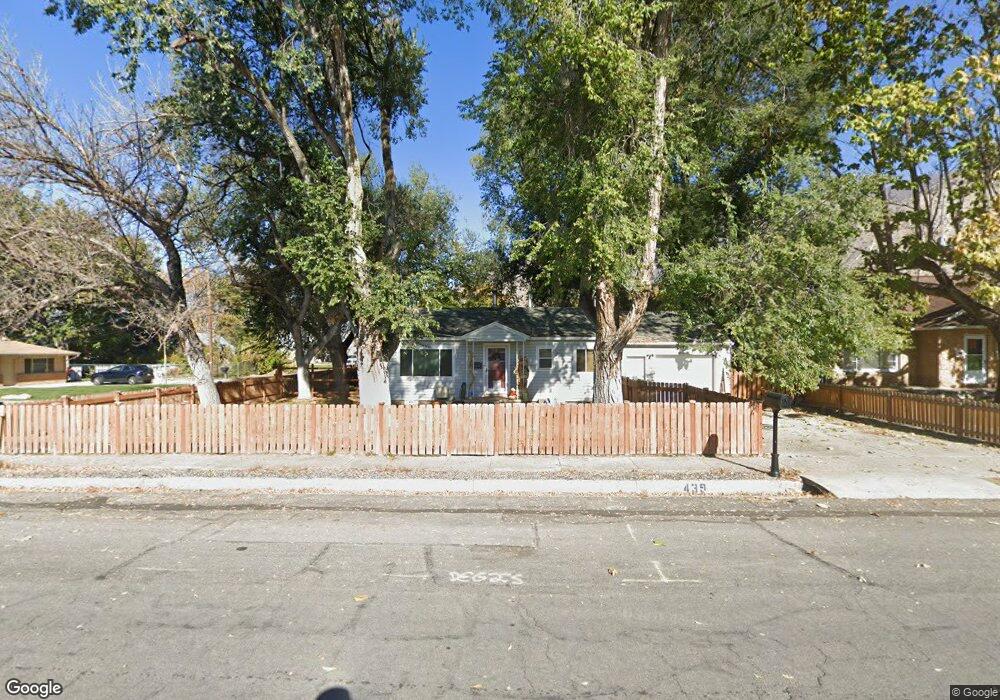
439 E 100 S Springville, UT 84663
Estimated Value: $338,000 - $372,286
2
Beds
1
Bath
782
Sq Ft
$460/Sq Ft
Est. Value
About This Home
This home is located at 439 E 100 S, Springville, UT 84663 and is currently estimated at $359,429, approximately $459 per square foot. 439 E 100 S is a home located in Utah County with nearby schools including Brookside School, Springville Junior High School, and Springville High School.
Ownership History
Date
Name
Owned For
Owner Type
Purchase Details
Closed on
Sep 27, 2025
Sold by
Munford Migueal
Bought by
Munford Migueal
Current Estimated Value
Home Financials for this Owner
Home Financials are based on the most recent Mortgage that was taken out on this home.
Original Mortgage
$80,000
Outstanding Balance
$80,000
Interest Rate
6.58%
Mortgage Type
Credit Line Revolving
Estimated Equity
$279,429
Purchase Details
Closed on
Aug 11, 2024
Sold by
Munford Sara
Bought by
Munford Migueal
Purchase Details
Closed on
Dec 29, 2021
Sold by
Rojas and Angela
Bought by
Munford Migueal and Munford Sara
Home Financials for this Owner
Home Financials are based on the most recent Mortgage that was taken out on this home.
Original Mortgage
$266,437
Interest Rate
3.11%
Mortgage Type
FHA
Purchase Details
Closed on
Jun 23, 2014
Sold by
Brooks Melissa and Warren Samuel John
Bought by
Rojas Jose
Home Financials for this Owner
Home Financials are based on the most recent Mortgage that was taken out on this home.
Original Mortgage
$155,138
Interest Rate
4.75%
Mortgage Type
FHA
Purchase Details
Closed on
Jul 20, 2012
Sold by
Warren Rachel Juel and Warren Kent
Bought by
Brooks Melissa and Warren Samuel John
Purchase Details
Closed on
Dec 6, 2005
Sold by
Scott John and Scott Ana
Bought by
Warren Kent
Create a Home Valuation Report for This Property
The Home Valuation Report is an in-depth analysis detailing your home's value as well as a comparison with similar homes in the area
Home Values in the Area
Average Home Value in this Area
Purchase History
| Date | Buyer | Sale Price | Title Company |
|---|---|---|---|
| Munford Migueal | -- | First American Title Insurance | |
| Munford Migueal | -- | None Listed On Document | |
| Munford Migueal | -- | Amrock | |
| Rojas Jose | -- | Inwest Title | |
| Brooks Melissa | -- | None Available | |
| Warren Kent | -- | Old Republic Title Company |
Source: Public Records
Mortgage History
| Date | Status | Borrower | Loan Amount |
|---|---|---|---|
| Open | Munford Migueal | $80,000 | |
| Previous Owner | Munford Migueal | $266,437 | |
| Previous Owner | Rojas Jose | $155,138 |
Source: Public Records
Tax History
| Year | Tax Paid | Tax Assessment Tax Assessment Total Assessment is a certain percentage of the fair market value that is determined by local assessors to be the total taxable value of land and additions on the property. | Land | Improvement |
|---|---|---|---|---|
| 2025 | $1,545 | $179,520 | -- | -- |
| 2024 | $1,545 | $158,235 | $0 | $0 |
| 2023 | $1,483 | $152,075 | $0 | $0 |
| 2022 | $1,686 | $169,840 | $0 | $0 |
| 2021 | $1,489 | $233,400 | $108,300 | $125,100 |
| 2020 | $1,311 | $199,200 | $80,200 | $119,000 |
| 2019 | $1,135 | $175,600 | $66,800 | $108,800 |
| 2018 | $1,062 | $156,700 | $62,100 | $94,600 |
| 2017 | $967 | $75,790 | $0 | $0 |
| 2016 | $841 | $64,625 | $0 | $0 |
| 2015 | $808 | $63,525 | $0 | $0 |
| 2014 | $814 | $63,525 | $0 | $0 |
Source: Public Records
Map
Nearby Homes
Your Personal Tour Guide
Ask me questions while you tour the home.