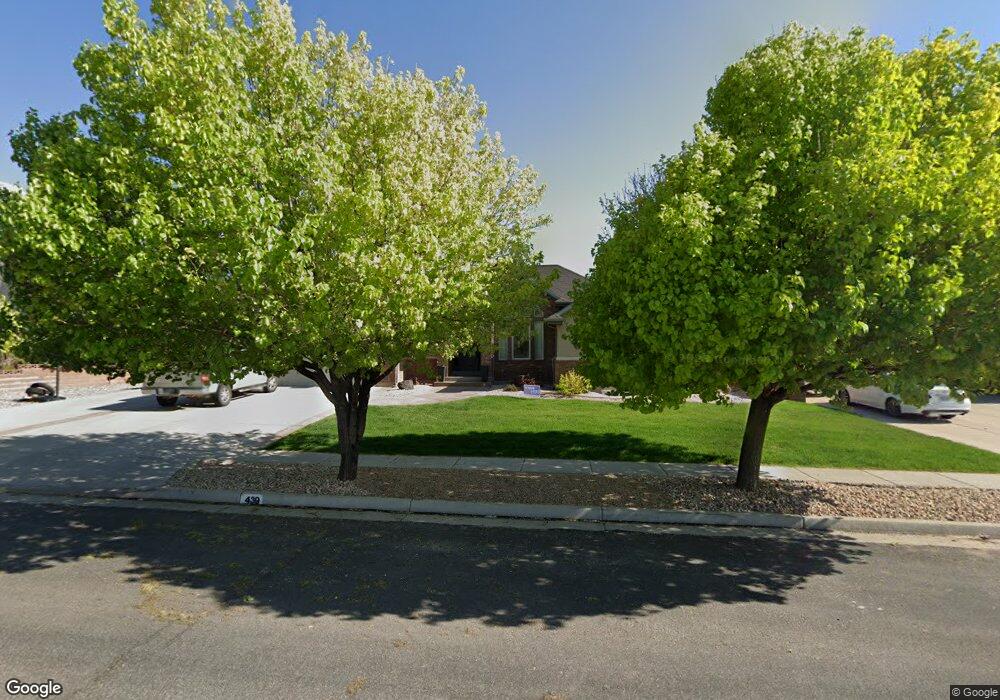
439 E 1010 N Richfield, UT 84701
Estimated Value: $548,578 - $715,000
5
Beds
3
Baths
3,450
Sq Ft
$177/Sq Ft
Est. Value
About This Home
This home is located at 439 E 1010 N, Richfield, UT 84701 and is currently estimated at $610,645, approximately $176 per square foot. 439 E 1010 N is a home located in Sevier County with nearby schools including Pahvant School, Ashman School, and Red Hills Middle School.
Ownership History
Date
Name
Owned For
Owner Type
Purchase Details
Closed on
Sep 30, 2015
Sold by
Morgan Patsey A
Bought by
Mullen Todd and Mullen Michelle
Current Estimated Value
Home Financials for this Owner
Home Financials are based on the most recent Mortgage that was taken out on this home.
Original Mortgage
$241,000
Outstanding Balance
$188,114
Interest Rate
3.89%
Mortgage Type
New Conventional
Estimated Equity
$422,531
Purchase Details
Closed on
Jul 3, 2007
Sold by
Bogh Tom
Bought by
Morgan James D and Morgan Patsey A
Create a Home Valuation Report for This Property
The Home Valuation Report is an in-depth analysis detailing your home's value as well as a comparison with similar homes in the area
Purchase History
| Date | Buyer | Sale Price | Title Company |
|---|---|---|---|
| Mullen Todd | -- | First American Title | |
| Morgan James D | -- | First American Title |
Source: Public Records
Mortgage History
| Date | Status | Borrower | Loan Amount |
|---|---|---|---|
| Open | Mullen Todd | $241,000 |
Source: Public Records
Tax History
| Year | Tax Paid | Tax Assessment Tax Assessment Total Assessment is a certain percentage of the fair market value that is determined by local assessors to be the total taxable value of land and additions on the property. | Land | Improvement |
|---|---|---|---|---|
| 2025 | $2,795 | $287,914 | $46,744 | $241,170 |
| 2024 | $2,795 | $292,661 | $39,548 | $253,113 |
| 2023 | $2,896 | $315,754 | $37,903 | $277,851 |
| 2022 | $2,873 | $262,331 | $39,237 | $223,094 |
| 2021 | $2,686 | $206,400 | $32,308 | $174,092 |
| 2020 | $2,528 | $188,898 | $42,900 | $145,998 |
| 2019 | $2,164 | $171,210 | $35,750 | $135,460 |
| 2018 | $2,416 | $171,210 | $35,750 | $135,460 |
| 2017 | $2,387 | $161,470 | $35,750 | $125,720 |
| 2016 | $1,743 | $161,470 | $0 | $0 |
| 2015 | $1,743 | $159,510 | $0 | $0 |
| 2014 | $1,743 | $151,870 | $0 | $0 |
Source: Public Records
Map
Nearby Homes
Your Personal Tour Guide
Ask me questions while you tour the home.