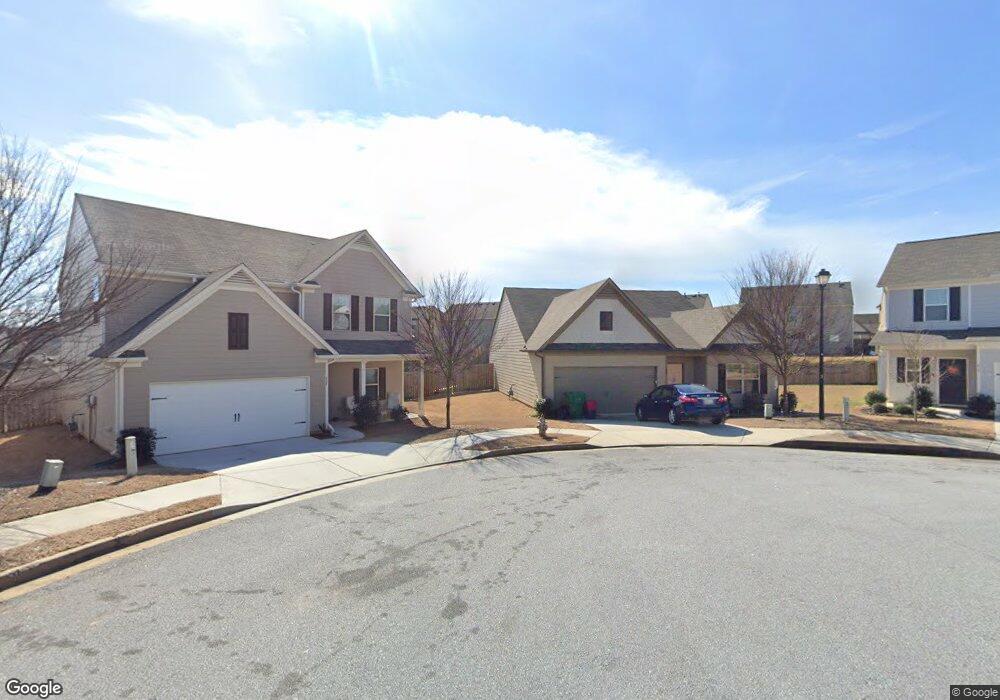
439 Fall Ct Unit 412 Pendergrass, GA 30567
Estimated Value: $301,000 - $357,000
3
Beds
2
Baths
1,601
Sq Ft
$204/Sq Ft
Est. Value
About This Home
This home is located at 439 Fall Ct Unit 412, Pendergrass, GA 30567 and is currently estimated at $326,379, approximately $203 per square foot. 439 Fall Ct Unit 412 is a home located in Jackson County with nearby schools including North Jackson Elementary School, West Jackson Middle School, and Jackson County High School.
Ownership History
Date
Name
Owned For
Owner Type
Purchase Details
Closed on
Oct 30, 2018
Sold by
Lgi Homes Georgia Llc
Bought by
Durbin Larry
Current Estimated Value
Home Financials for this Owner
Home Financials are based on the most recent Mortgage that was taken out on this home.
Original Mortgage
$184,803
Outstanding Balance
$160,829
Interest Rate
4.7%
Estimated Equity
$165,550
Purchase Details
Closed on
Apr 14, 2015
Sold by
Wm Sub Sp Llc
Bought by
Lgi Homes Georgia Llc
Purchase Details
Closed on
Oct 23, 2013
Sold by
Walton Georgia Llc
Bought by
Wm Sub Sp Llc
Purchase Details
Closed on
Mar 7, 2013
Sold by
Scbt Na D/B/A Cbt A Division O
Bought by
Walton Georgia Llc
Purchase Details
Closed on
Aug 2, 2011
Sold by
Rel Development Inc
Bought by
Scbt Na D/B/A Cbt A Division Of Scbt Na
Create a Home Valuation Report for This Property
The Home Valuation Report is an in-depth analysis detailing your home's value as well as a comparison with similar homes in the area
Home Values in the Area
Average Home Value in this Area
Purchase History
| Date | Buyer | Sale Price | Title Company |
|---|---|---|---|
| Durbin Larry | $178,900 | -- | |
| Lgi Homes Georgia Llc | $2,212,500 | -- | |
| Wm Sub Sp Llc | $2,300 | -- | |
| Walton Georgia Llc | $2,000 | -- | |
| Scbt Na D/B/A Cbt A Division Of Scbt Na | -- | -- |
Source: Public Records
Mortgage History
| Date | Status | Borrower | Loan Amount |
|---|---|---|---|
| Open | Durbin Larry | $184,803 |
Source: Public Records
Tax History
| Year | Tax Paid | Tax Assessment Tax Assessment Total Assessment is a certain percentage of the fair market value that is determined by local assessors to be the total taxable value of land and additions on the property. | Land | Improvement |
|---|---|---|---|---|
| 2024 | $3,541 | $120,080 | $23,400 | $96,680 |
| 2023 | $3,564 | $108,280 | $23,400 | $84,880 |
| 2022 | $2,835 | $90,120 | $23,400 | $66,720 |
| 2021 | $2,621 | $82,720 | $16,000 | $66,720 |
| 2020 | $2,363 | $68,920 | $16,000 | $52,920 |
| 2019 | $2,364 | $67,760 | $16,000 | $51,760 |
| 2018 | $579 | $16,000 | $16,000 | $0 |
| 2017 | $584 | $16,000 | $16,000 | $0 |
| 2016 | $176 | $4,800 | $4,800 | $0 |
| 2015 | $74 | $2,000 | $2,000 | $0 |
| 2014 | $34 | $2,000 | $2,000 | $0 |
| 2013 | -- | $4,800 | $4,800 | $0 |
Source: Public Records
Map
Nearby Homes
- 723 Independence Ave
- 1063 Sope Creek Cir
- 1039 Sope Creek Cir
- 331 Merigold Way
- 640 Independence Ave
- 1042 Sope Creek Cir
- 837 Summer Springs Ct
- 306 Seasons Valley
- 410 Winter Chase
- 110 Pendergrass Farms Cir
- 735 Walnut Creek Cir
- 72 Hidden Pines Cir
- 575 Cottage Loop
- 605 Whirlaway St
- 526 Whirlaway St
- 177 Whirlaway St
- 5592 Old Pendergrass Rd
- 1028 Sope Creek Cir
- 1075 Sope Creek Cir
- 954 Sope Creek Cir
- 429 Fall Ct Unit 411
- 430 Fall Ct
- 724 Independence Ave
- 724 Independence Ave
- 724 Independence Ave Unit 381
- 720 Independence Ave Unit 382
- 720 Independence Ave
- 728 Independence Ave Unit 380
- 524 Sunrise Ln Unit 402
- 524 Sunrise Ln
- 524 Sunrise Ln
- 716 Independence Ave Unit 383
- 716 Independence Ave
- 4720 Fall Ct
- 732 Independence Ave Unit 379
- 732 Independence Ave
- 419 Fall Ct Unit 410
- 419 Fall Ct
- 420 Fall Ct
- 710 Independence Ave Unit 384