Estimated Value: $407,000 - $433,000
3
Beds
2
Baths
1,461
Sq Ft
$286/Sq Ft
Est. Value
About This Home
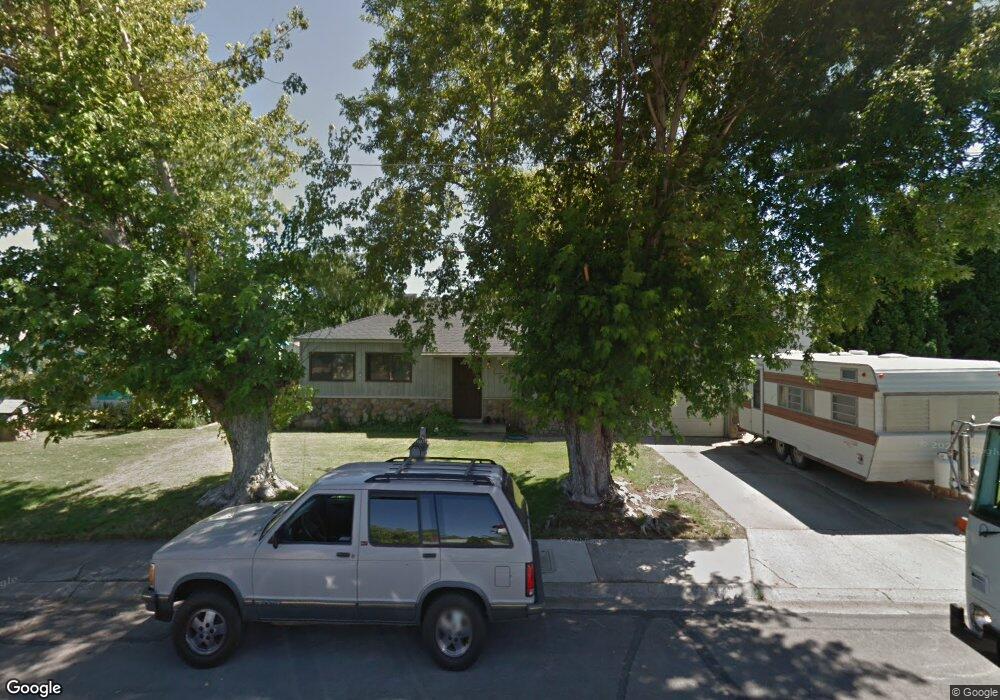
This home is located at 439 J St, Sparks, NV 89431 and is currently estimated at $417,441, approximately $285 per square foot. 439 J St is a home located in Washoe County with nearby schools including Greenbrae Elementary School, George L Dilworth Middle School, and Sparks High School.
Ownership History
Date
Name
Owned For
Owner Type
Purchase Details
Closed on
Oct 26, 1994
Sold by
Betty James F
Bought by
Betty James F
Current Estimated Value
Home Financials for this Owner
Home Financials are based on the most recent Mortgage that was taken out on this home.
Original Mortgage
$30,000
Interest Rate
8.7%
Purchase Details
Closed on
Aug 5, 1994
Sold by
Betty Cathy S
Bought by
Betty James F
Create a Home Valuation Report for This Property
The Home Valuation Report is an in-depth analysis detailing your home's value as well as a comparison with similar homes in the area
Home Values in the Area
Average Home Value in this Area
Purchase History
| Date | Buyer | Sale Price | Title Company |
|---|---|---|---|
| Betty James F | -- | Western Title Company Inc | |
| Betty James F | -- | -- |
Source: Public Records
Mortgage History
| Date | Status | Borrower | Loan Amount |
|---|---|---|---|
| Previous Owner | Betty James F | $30,000 |
Source: Public Records
Tax History
| Year | Tax Paid | Tax Assessment Tax Assessment Total Assessment is a certain percentage of the fair market value that is determined by local assessors to be the total taxable value of land and additions on the property. | Land | Improvement |
|---|---|---|---|---|
| 2026 | -- | $55,482 | $34,090 | $21,392 |
| 2024 | $948 | $51,010 | $30,065 | $20,945 |
| 2023 | $922 | $50,739 | $31,325 | $19,414 |
| 2022 | $896 | $41,980 | $26,180 | $15,800 |
| 2021 | $870 | $33,271 | $17,955 | $15,316 |
| 2020 | $843 | $32,055 | $16,940 | $15,115 |
| 2019 | $819 | $30,300 | $15,890 | $14,410 |
| 2018 | $795 | $25,547 | $11,725 | $13,822 |
| 2017 | $772 | $24,096 | $10,395 | $13,701 |
| 2016 | $754 | $23,835 | $9,345 | $14,490 |
| 2015 | $753 | $22,608 | $7,700 | $14,908 |
| 2014 | $731 | $21,208 | $6,440 | $14,768 |
| 2013 | -- | $19,435 | $4,270 | $15,165 |
Source: Public Records
Map
Nearby Homes
Your Personal Tour Guide
Ask me questions while you tour the home.